

Original
Influence of sex, age and body mass index on healthy colon anatomy
Influencia del sexo, la edad y el índice de masa corporal en la anatomía del colon sano. Variaciones anatómicas del colon sano.
Actual Med.2022;107(815):18-26 DOI: 10.15568/am.2022.815.or02
Recibido: 15/07/2021
Revisado: 21/02/2022
Aceptado: 09/03/2022
ABSTRACT
Objective: This study analyzes the influence of sex, age and body mass index on the anatomy of the colon as determined by three-dimensional reconstructions from computed tomography scans.
Methods: 130 patients were included, each of whom underwent a three-dimensional reconstruction of the colon from abdominal CT scans without obvious signs of pathology. Information corresponding to sex, age and body mass index was obtained from each patient, and morphometric data obtained from measurements taken at the pubic symphysis, superior and inferior mesenteric artery, hepatic angle, splenic angle, ileocecal junction and sigmoid-descending colon junction were considered.
Results: Morphological analysis showed an important anatomical variability of the reconstructed colon. Statistical analysis showed significant differences in the measurements obtained when grouping subjects by sex, age (under 65 years vs over 65 years) and body mass index (normopese, overweight and obese).
Conclusions: Colon anatomical variations can be studied with three-dimensional reconstructions from CT scans, indicating that sex, age and body mass index have a significant influence on such variability.
Keywords: Anatomy; Anatomical variability; Three-dimensional reconstruction; Computed tomography.
RESUMEN
Objetivo: Este estudio analiza la influencia del sexo, la edad y el índice de masa corporal en la anatomía del colon, determinada por reconstrucciones tridimensionales, a partir de tomografías computarizadas.
Metodología: Se incluyeron 130 pacientes, a cada uno de los cuales se les realizó una reconstrucción tridimensional del colon, a partir de tomografías computarizadas abdominales sin signos evidentes de patología. De cada paciente se obtuvo información correspondiente a las variables sexo, edad e índice de masa corporal, y se consideraron los datos morfométricos obtenidos de las mediciones realizadas en la sínfisis púbica, arteria mesentérica superior e inferior, ángulo hepático, ángulo esplénico, unión ileocecal y unión del colon sigmoideo-descendente.
Resultados: El análisis morfológico mostró una importante variabilidad anatómica del colon reconstruido. El análisis estadístico mostró diferencias significativas en las medidas obtenidas al agrupar a los sujetos por sexo, edad (menores de 65 años vs mayores de 65 años) e índice de masa corporal (normopeso, sobrepeso y obesidad).
Conclusiones: Las variaciones anatómicas del colon pueden estudiarse con reconstrucciones tridimensionales a partir de tomografías computarizadas, lo que indica que el sexo, la edad y el índice de masa corporal tienen una influencia significativa en dicha variabilidad.
Palabras clave: Anatomía; Variabilidad anatómica; Reconstrucción tridimensional; Tomografía computarizada.
Leer Artículo Completo
INTRODUCTION
The anatomy of the colon has been extensively studied. Seminal works have described in detail the colon’s embryonic development (1) the morphology of its different segments, and its relationships with adjacent structures, including viscera and bones. (2,3) In addition, corpse dissection studies have helped to expand this organ. (4,5) The radiological anatomy of the colon is well-known, assisting study of the substantial anatomical variability of this organ. (6) Three-dimensional reconstruction technologies based on radiological images, whether obtained via computerized tomography, nuclear magnetic resonance, or virtual colonoscopy, has been an important development in this respect, allowing enhanced anatomical description of the colon. (7,8,9,10) Moreover, three-dimensional reconstruction improves the clinical applicability of results, helping to establish preoperative surgical planning strategies that facilitate surgical approaches and the development of operative techniques for this organ. (11,12,13) It can also allow the development of virtual anatomical models and simulation models for teaching and training in specific medical techniques, such as through computer models (14) models integrated in Portable Document Format (PDF) files for virtual navigation through the reconstructed structures (15,16) and physical models developed with current 3D printing methods. (17) The aim of this study was to describe and analyze how sex, age, and BMI influence the anatomy of the colon, as determined using three-dimensional reconstructions from computed tomography (CT) scans.
MATERIAL AND METHODS
Sample selection
One hundred and thirty patients were selected from the Hospital Royo Villanova in Zaragoza, each of whom underwent an abdominal CT scan with intravenous contrast after providing informed consent. Informed consent was obtained from all study participants. The clinical rationale for the CT scan should not influence the normal anatomy of the colon, and the study did not utilize scans that showed pathology at that level. In addition, all studied CT scans did not show intra-abdominal findings that might have an influence on anatomical changes. Those cases that did not meet these requirements were not included in the ultimate analysis.
The variables sex, age, and body mass index (BMI) were analyzed using information collected from each patient included in the study. BMI values were not obtained in 4 of the 130 patients (3.07%). These data allowed us to make three groups stratified by sex (men vs. women), age (65 years or younger vs. over 65, according to the median age of the study sample), and BMI (classified as normal weight if BMI was less than 24.99, overweight if BMI was between 25 and 29.99, and obese if BMI was greater than 30).
The use of the images and the retrospective collection of data were approved by the Clinical Research Ethics Committee of Aragón (CE PI17/O168). The work has been carried out in accordance with The Code of Ethics of the World Medical Association (Declaration of Helsinki) for experiments involving humans.
Image collection and processing.
The Siemens Somatom Perspective 64-slice CT (Siemens Medical Solutions, Erlangen, Germany) scanner was used to obtain all images. CT sections of the abdomen were made at 3-mm thicknesses. The images were converted into DICOM format using the platforms Syngo Via and Indra Alma 3D. The processing and measurement software packages used were OsiriX, Adobe Photoshop Elements 11 Editor, and ImageJ.
The surface of the colon was manually identified in all sections, changing the image density to obtain the three-dimensional reconstruction. Colour was applied to this three-dimensional image with the software Adobe Photoshop Elements 11.
Reference points were identified in axial CT sections, which were reflected in the three-dimensional image. These included the midpoint of the pubic symphysis (PUBIS), the origin of the superior mesenteric artery (SMA), the origin of the inferior mesenteric artery (IMA), the highest point of the colon in the right hemiabdomen—in the area of transition between the ascending colon and the transverse colon (hepatic flexure (HF)—the highest point of the colon in the left hemiabdomen—in the transition zone between the transverse colon and the descending colon (splenic flexure (SF))—the entrance of the terminal ileum into the caecum (ICJ), and the sigmoid-descending colon junction—in the entrance area to the pelvis (SDJ). The proposed length and angle measures are detailed in the attached figure (Figure 1A-C). These measurements were made with ImageJ software and calculated in pixels, subsequently transformed into centimeters, and expressed in sexagesimal degrees.

Figure 1. Location of the variables proposed in this study as reference points and useful for length and angle measurements. A. Proposed reference points. B. Proposed length measurements PUBIS – SMA, PUBIS – IMA, SMA – IMA, PUBIS – HF, PUBIS – SF, PUBIS – ICJ, PUBIS – SDJ, SMA – HF, SMA – SF, IMA – HF, IMA – SF. C. Proposed angle measurements HF – PUBIS – SF, HF – SMA – SF, HF – IMA – SF.
Statistical analysis.
The morphometric data obtained were analyzed with SPSS. Quantitative variables were described by either the mean and standard deviation (SD) or the range and interquartile range (IQR). For comparisons between two quantitative variables, Student’s t-test or Mann-Whitney U test was used according to the results of Kolmogorov-Smirnov normality testing. Analysis of variance (ANOVA) or the Kruskal-Wallis test was used to compare differences between the means or ranges of three or more groups, according to whether the distributions were normal or not. If statistically significant differences were identified after applying the last two tests, the analysis was continued by applying a posteriori two-by-two contrasts—using the Bonferroni method for homoscedastic samples or Dunnett’s T3 test for heteroscedastic samples when having used the ANOVA test—or the Mann-Whitney U statistic if the Kruskal-Wallis test was used. To quantify the degree of relationship between quantitative variables, the Pearson’s linear correlation coefficient (r) was used, considering the central limit theorem to consider sample normality. Statistical significance was considered to have been achieved with p-values <0.05.
RESULTS
Sample description
The study included 130 patients, of which 75 (57.69%) were men and 55 (42.31%) were women. The mean age of the study participants was 64.32 ± 16.41 years, and the mean BMI was 28.41 ± 5.49. In the 75 men, the mean age was 63.40 ± 15.43 years, and the BMI range was 28.53 (IQR: 5.71). In the group of 55 women, the mean age was 65.54 ± 17.72 years, and the BMI range was 24.09 (IQR: 8.56) There were no significant differences between the two groups (p=0.526 and p= 0.448 respectively).
Morphological analysis
Individual morphological analysis showed substantial anatomical variability of the reconstructed colon, as demonstrated in several of the most representative anatomical cases.
Analysis of morphometric variables by sex
When comparing morphometric variables between men and women, only three variables were greater in women than in men, which were statistically significant for the distance PUBIS – IMA (16.62 vs. 17.98 cm), and the angle HF – IMA – SF (105.21º vs. 106.28º), but not significant for the distance PUBIS – SMA. The other morphometric variables were greater in men and were statistically significant for the distances SMA – IMA (7.14 vs. 6.32 cm), PUBIS – SF (29.70 vs. 27.76 cm), PUBIS – ICJ (14.63 vs. 12.75 cm), SMA – SF (10.92 vs. 7.06 cm), IMA – HF (11.28 vs. 9.60 cm), and IMA – SF (14.54 vs. 11.38 cm) (Table 1).
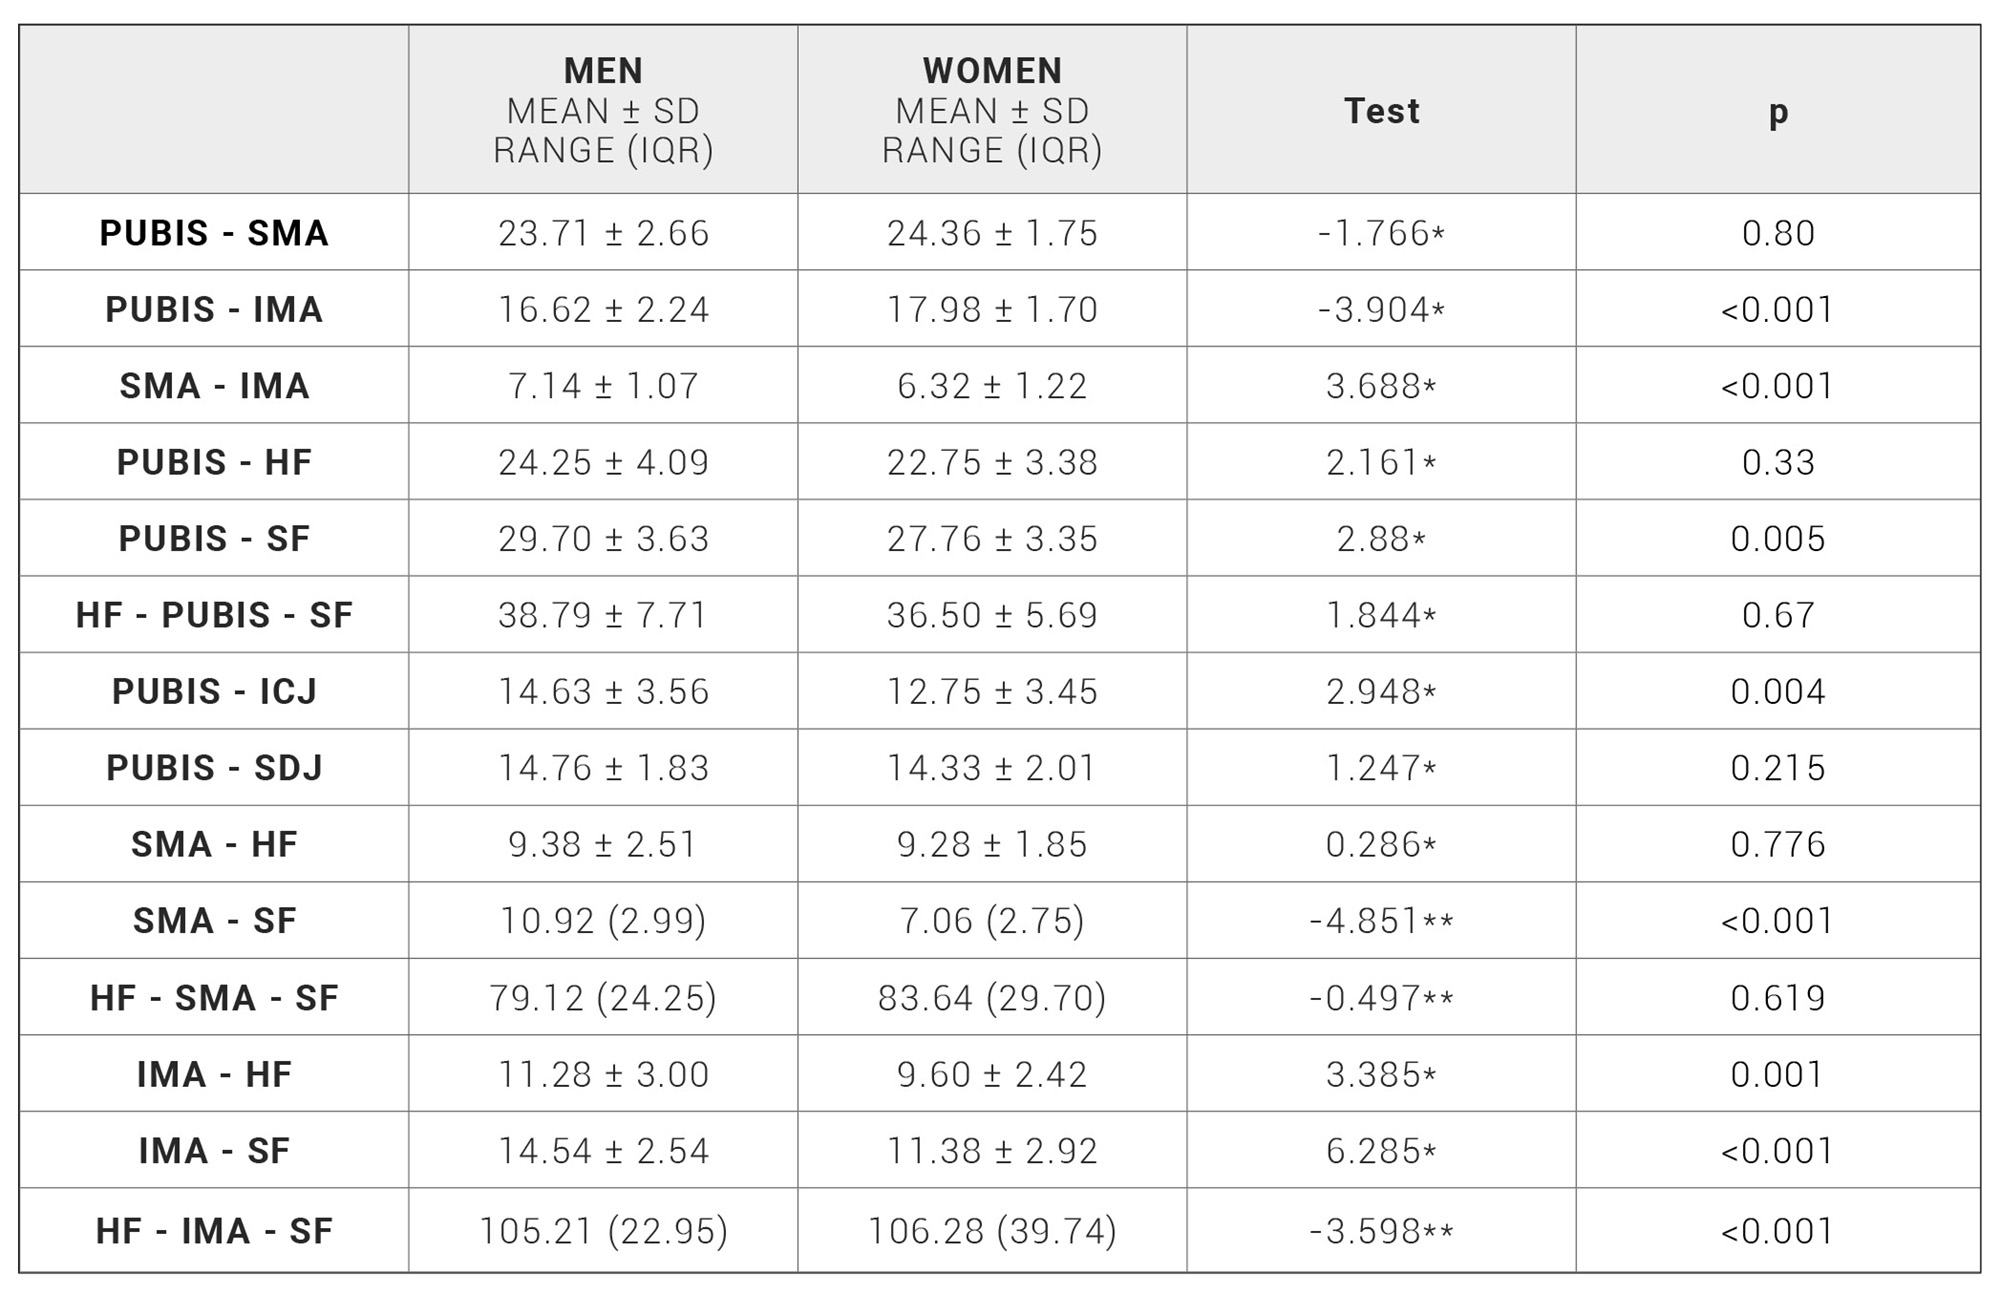
Table 1. Morphometric variables by sex. *: Student’s t-test [t statistic]. **: Mann-Whitney U test [Z statistic].
Analysis of morphometric variables by age
In comparisons of the morphometric variables between the two age groups (65 years or younger and over 65 years), of the three statistically significant differences, the distance PUBIS – SMA (9.10 vs. 10.95 cm) and the angle HF – PUBIS – SF (36.05º vs. 39.12º) were higher in the age group over 65 years, whereas the distance PUBIS – IMA (17.61 vs. 16.81 cm) was higher in the under 65 years age group (Table 2).
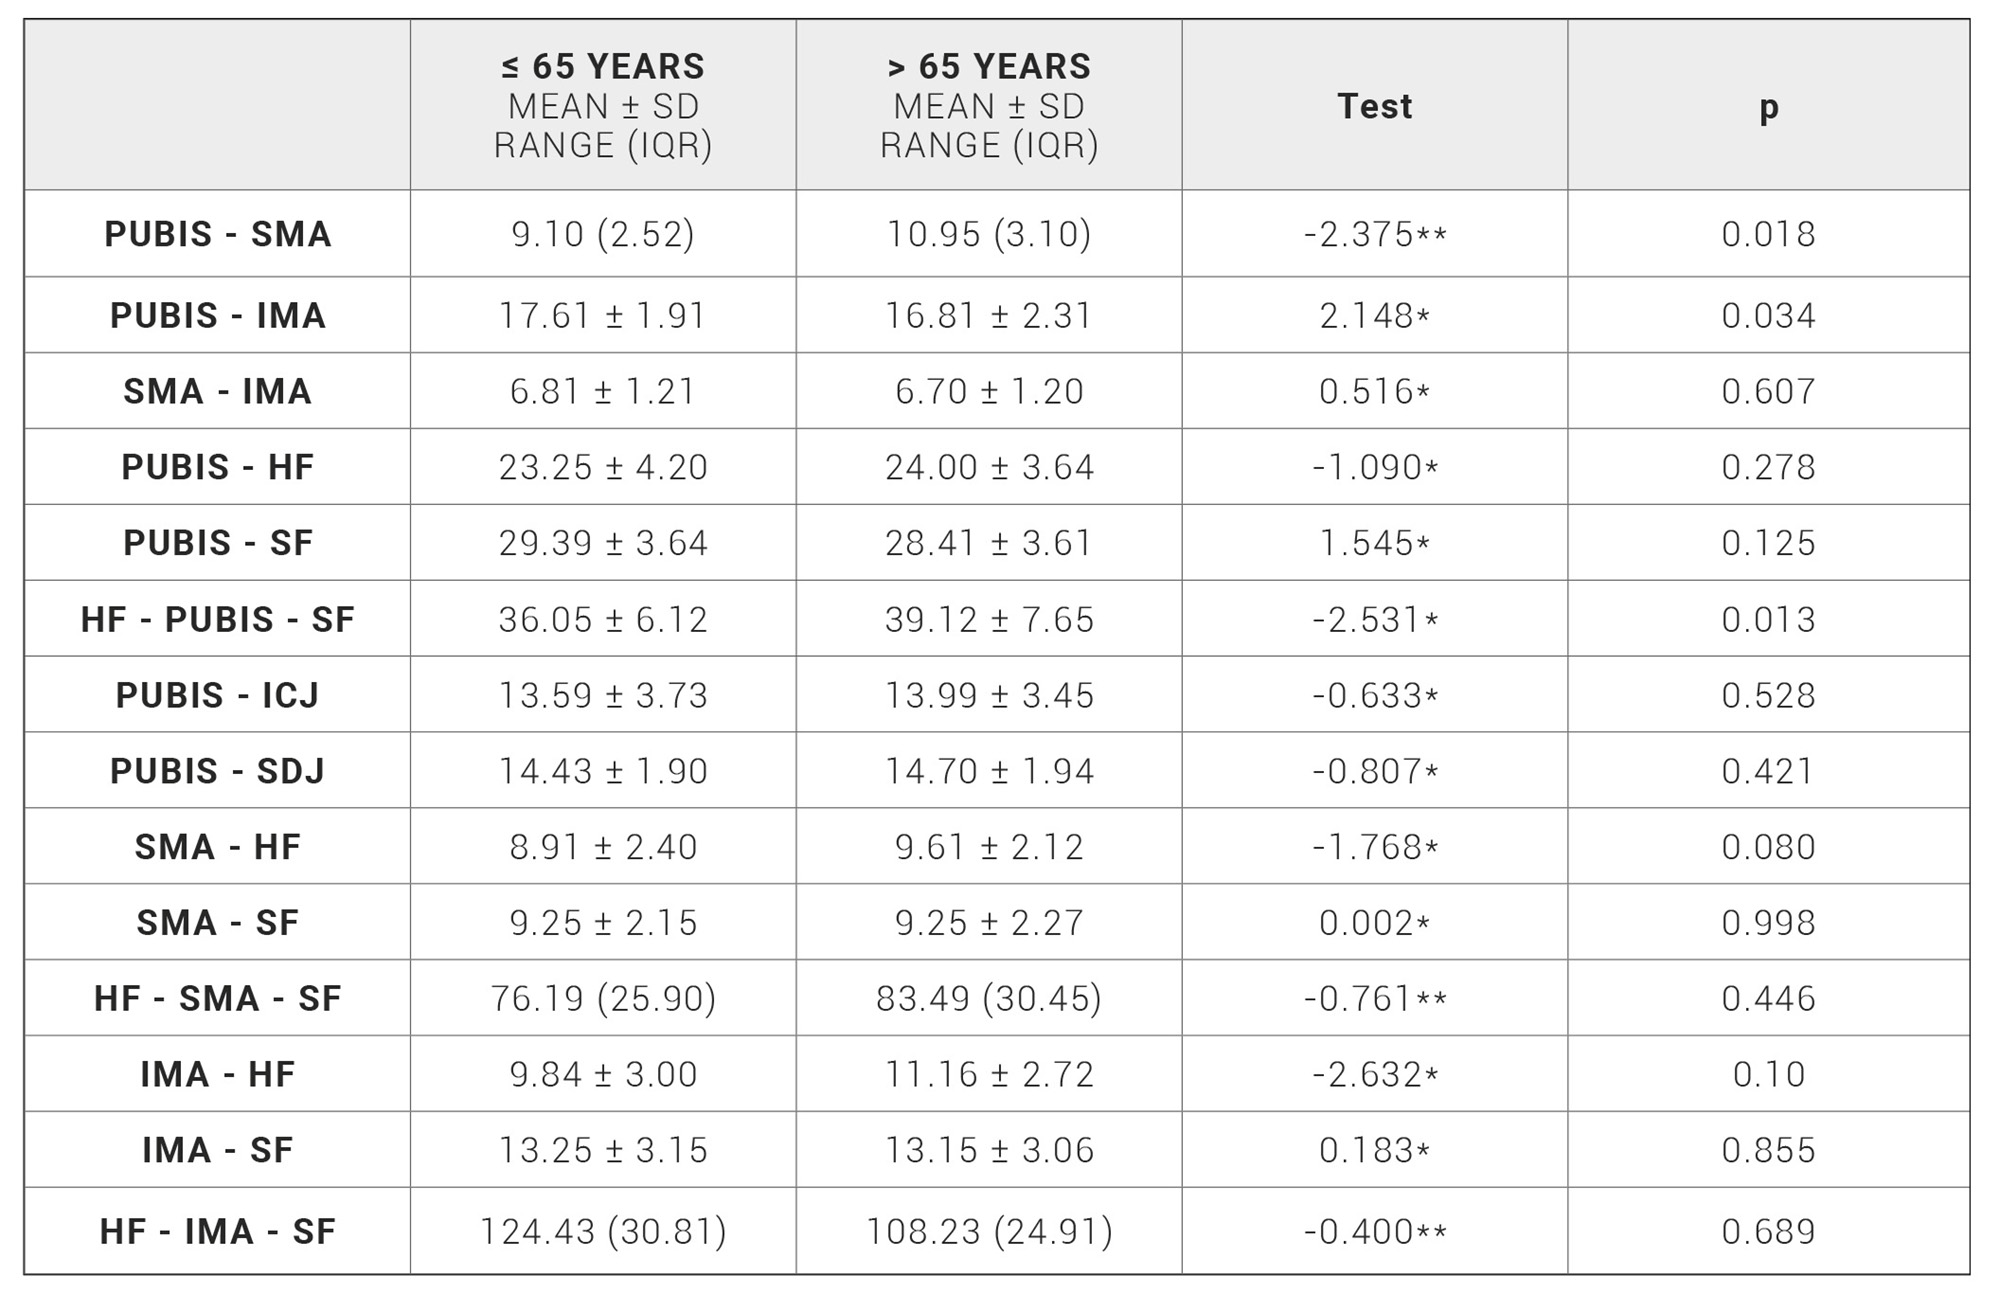
Table 2. Morphometric variables stratified by age. *: Student’s t-test [t statistic], **: Mann-Whitney U test [ Z statistic].
Analysis of morphometric variables by BMI
When comparing the morphometric variables between the normal weight, overweight, and obese groups, respectively, statistically significant differences were found for the distances SMA – IMA (6.35 vs. 6.92 vs. 7.00 cm), PUBIS – HF (15.15 vs. 18.55 vs. 15.87 cm), PUBIS – ICJ (12.03 vs. 14.13 vs. 14.92 cm), PUBIS – SDJ (8.31 vs. 7.79 vs. 10.62 cm), SMA – SF (8.31 vs. 9.62 vs. 9.56 cm), IMA – HF (8.85 vs. 10.97 vs. 11.49 cm) and IMA – SF (11.86 vs. 13.89 vs. 13.50 cm), as well as the angle HF – IMA – SF (115.04º vs. 96.86º vs. 95.81º). A posteriori two-by-two contrasts were further applied to analyses the morphometric variables discussed above that showed statistically significant differences between these three groups. The distance SMA – IMA showed a statistically significant difference between the normal weight and obese groups. The distance IMA – SF showed a statistically significant difference between the normal weight and overweight groups. The distances PUBIS – HF, PUBIS – ICJ, SMA – SF and IMA – HF, as well as the angle HF – IMA – SF, showed statistically significant differences between the normal weight and overweight groups, as well as the normal weight and obese groups. Only the distance PUBIS – SDJ showed statistically significant differences between the normal weight and overweight groups, the normal weight and obese groups, and the overweight and obese groups (Tables 3-4).
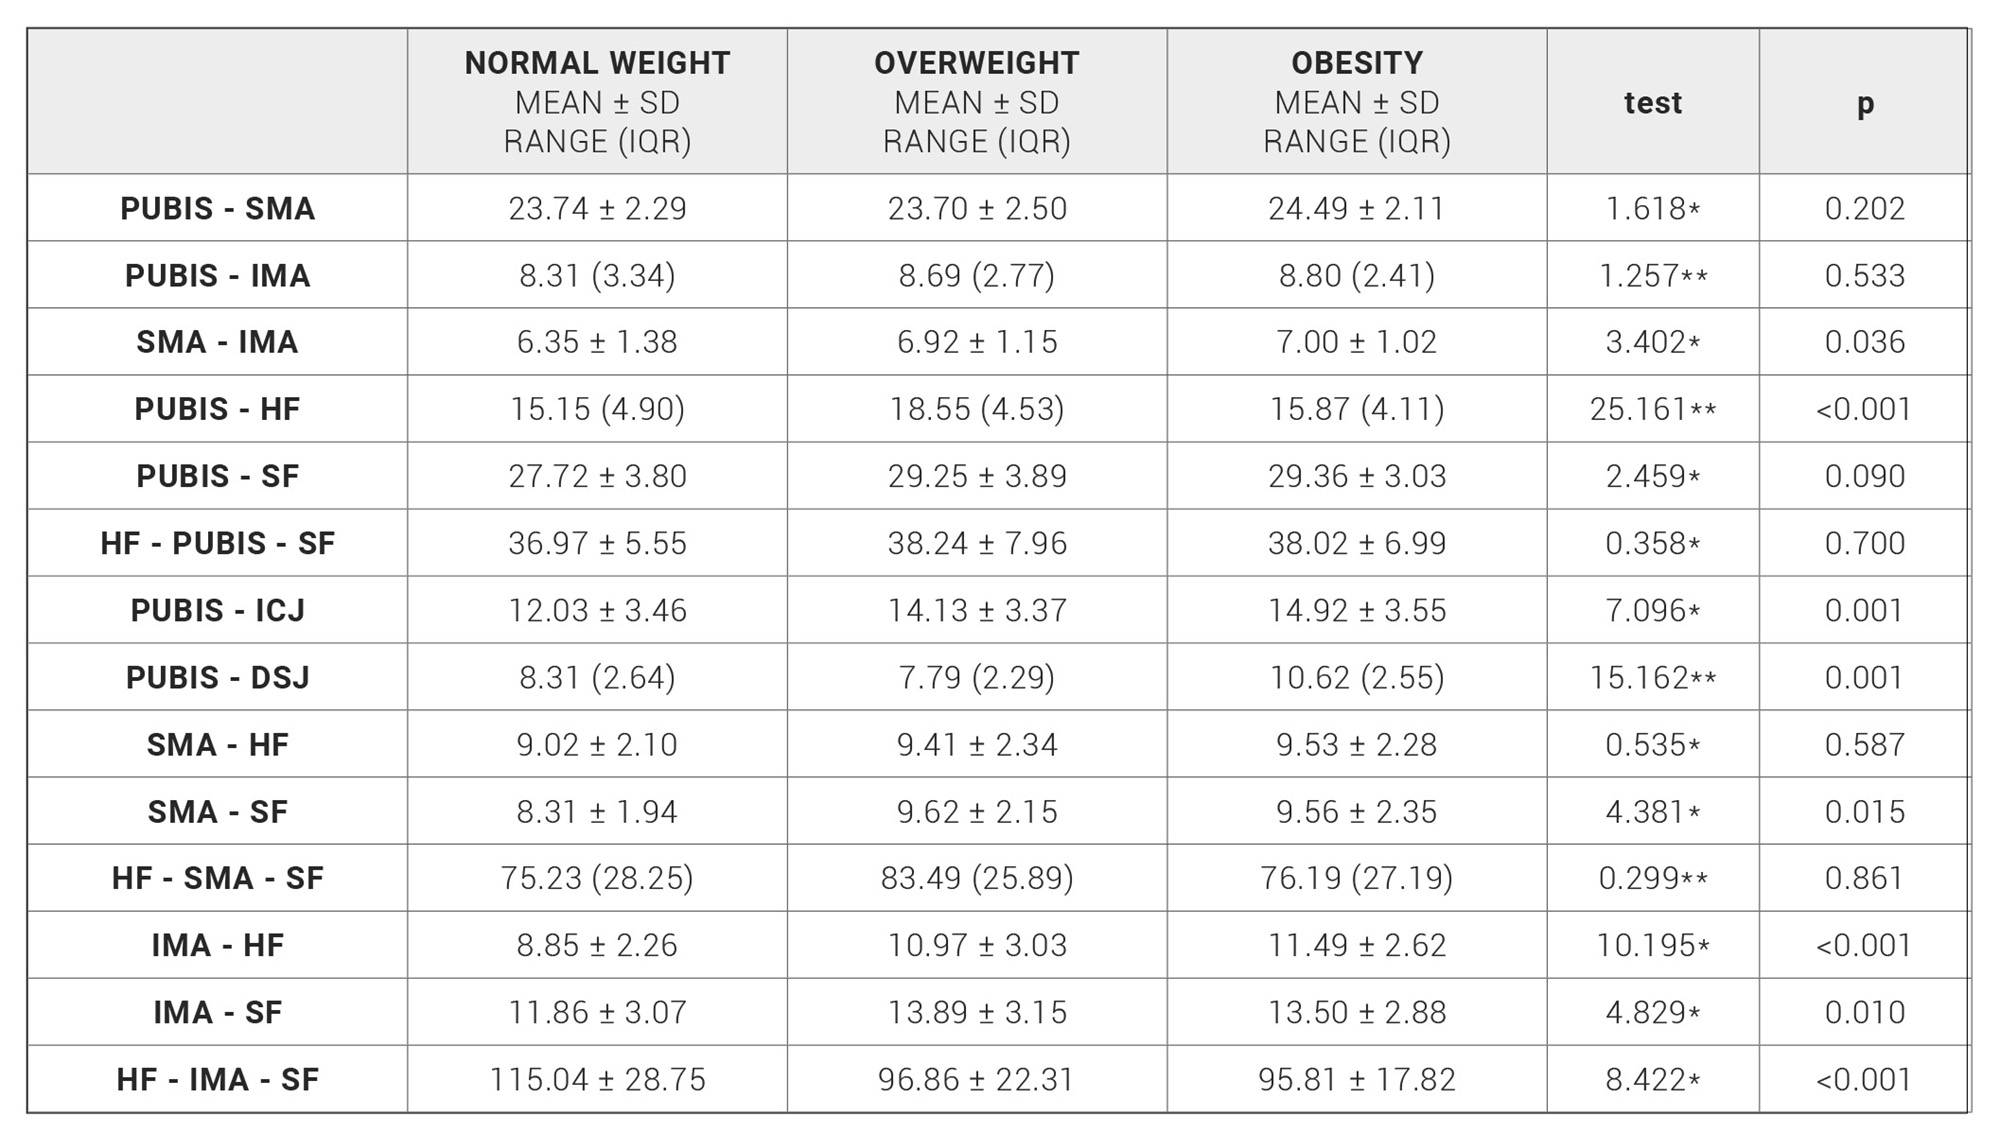
Table 3. Morphometric variables stratified by BMI. *: ANOVA [F statistic], **: Kruskal-Wallis test [KW statistic].

Table 4. Morphometric variables stratified by BMI after applying posteriori contrasts results with statistical significance. *: Bonferroni method,
**: Mann-Whitney U statistic, ***: Dunnett’s T3 test.
Correlation analysis between age, BMI, and morphometric variables
A positive and statistically significant correlation was found between age and the angle HF – PUBIS – SF (r = 0.328) and the distances SMA – HF (r = 0.241) and IMA – HF (r = 0.34); the correlation between age and the distance PUBIS – HF (r = 0.155) was close to statistical significance as well. The correlation with age was statistically significant but negative for the distances PUBIS – SMA (r = – 0.233) and PUBIS – IMA (r = – 0.245).
A positive and statistically significant correlation was observed between BMI and the distances PUBIS – SMA (r = 0.232), SMA – IMA (r = 0.276), PUBIS – HF (r = 0.492), PUBIS – SF (r = 0.273), PUBIS – ICJ (r = 0.442), PUBIS – SDJ (r = 0.354), SMA – SF (r = 0.351), IMA – HF (r = 0.369), and IMA – SF (r = 0.319). The correlation with BMI was statistically significant but negative for the angle HF – IMA – SF (r = – 0.293) (Table 5).
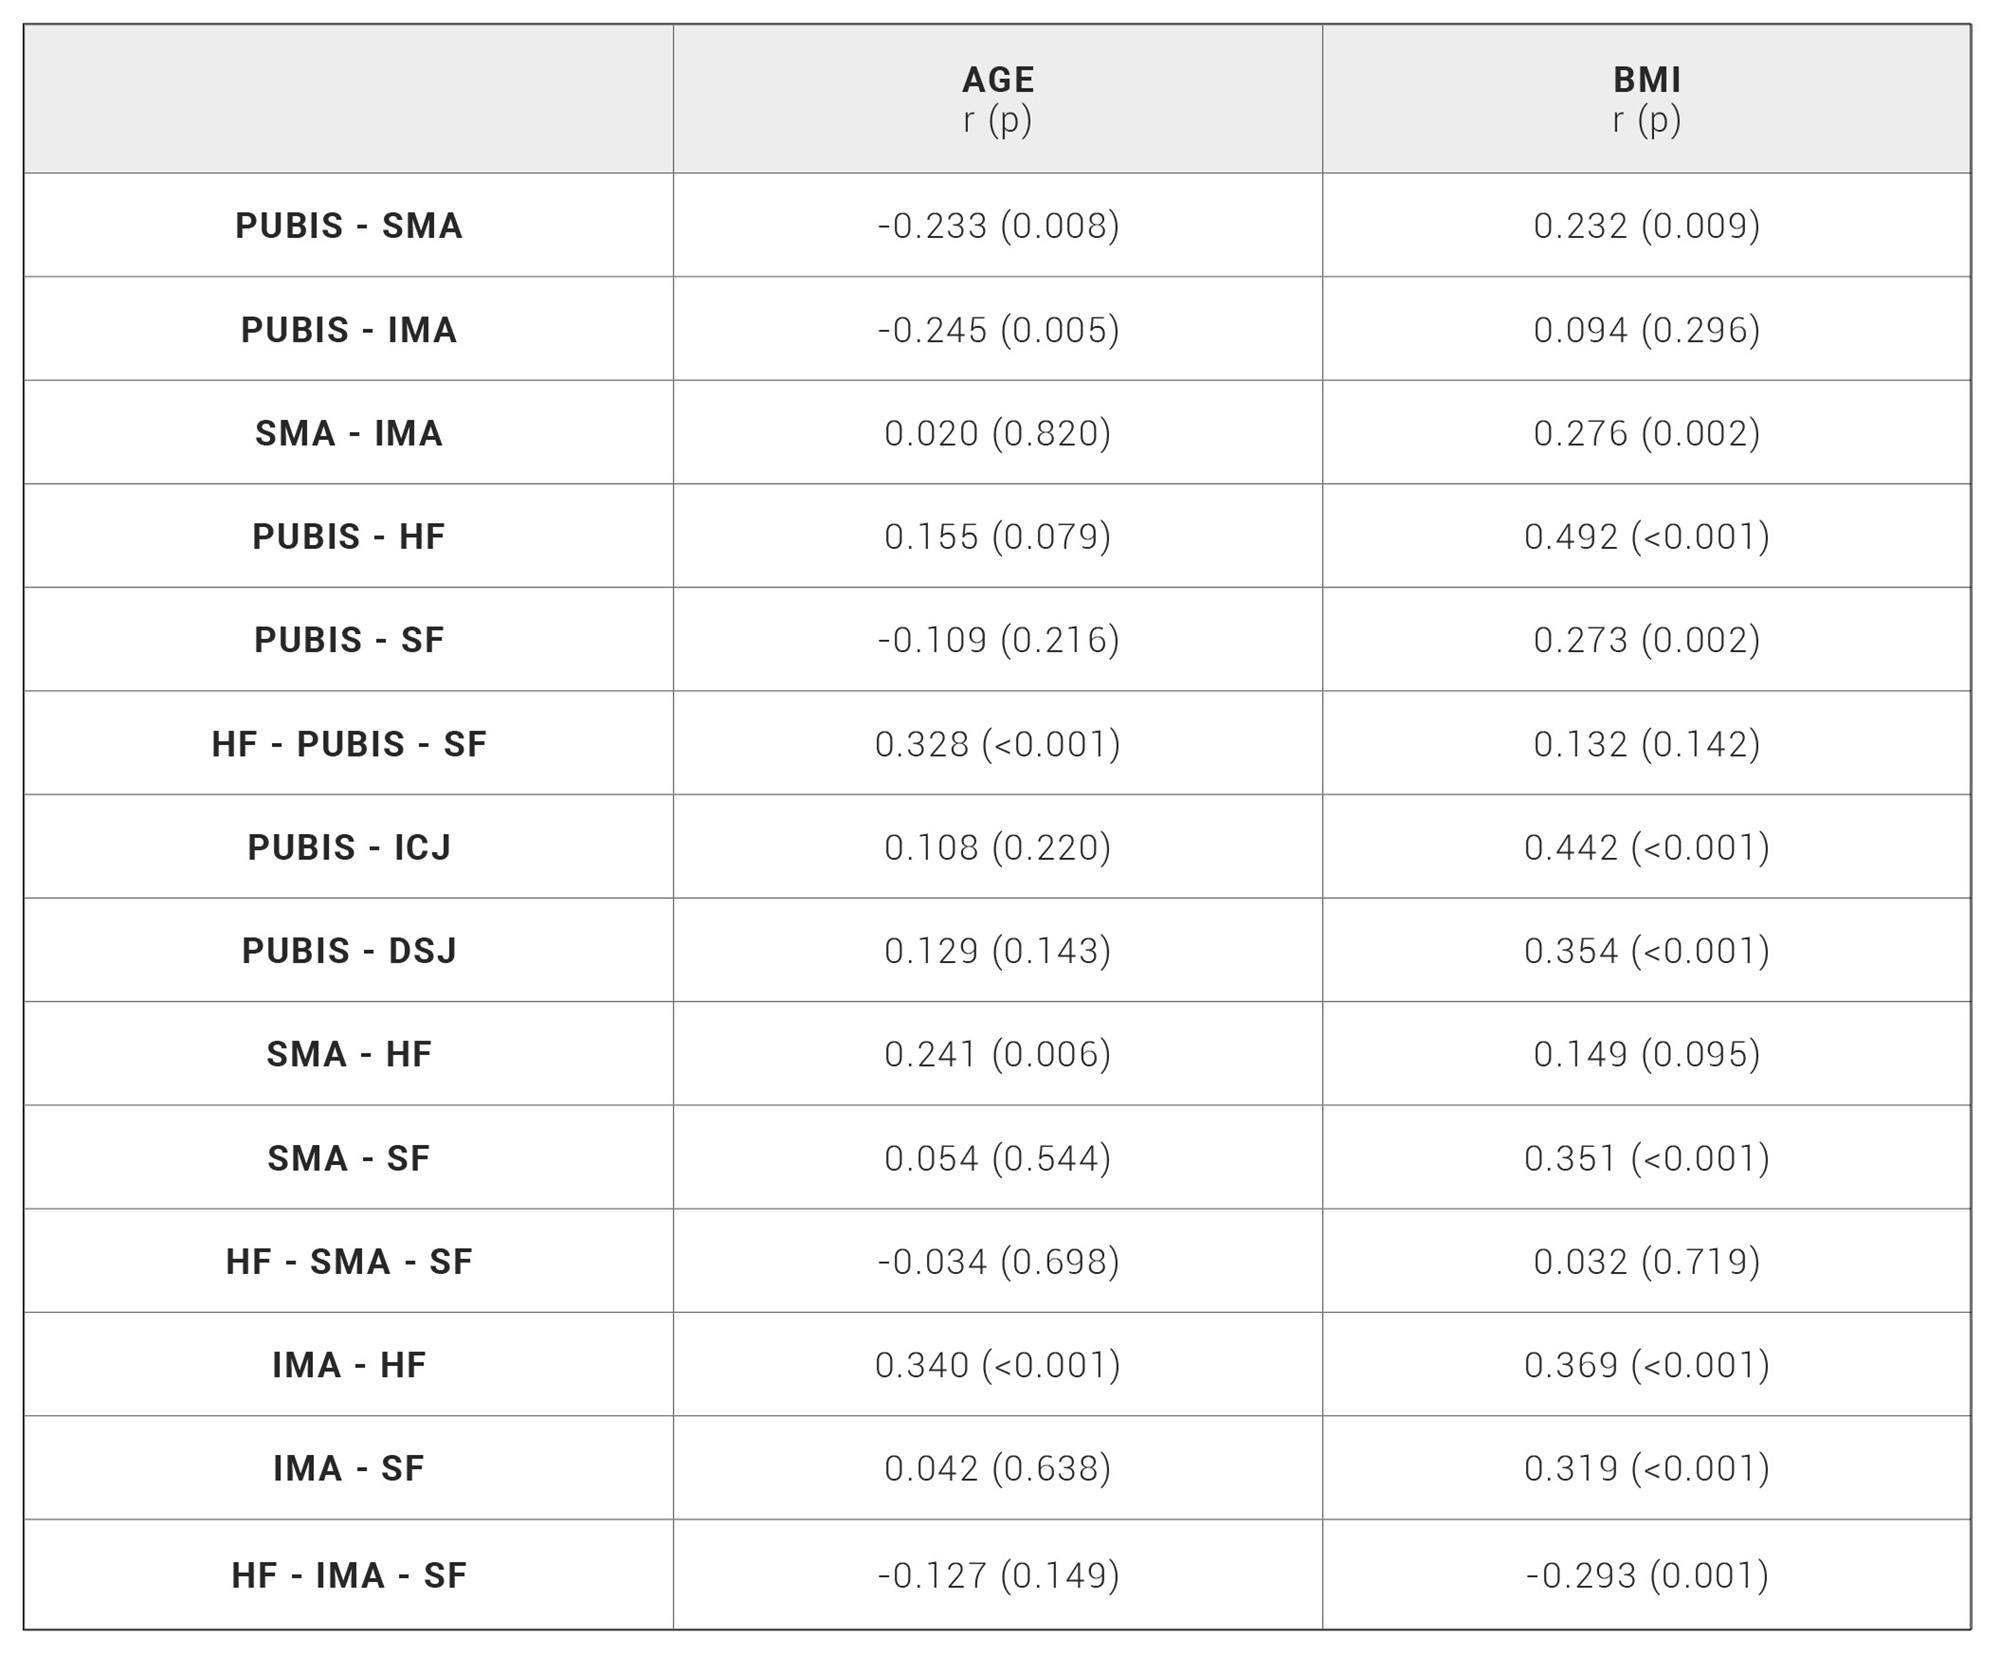
Table 5. Correlation between morphometric variables, age, and BMI.
DISCUSSION
Our study sought to demonstrate whether sex, age, and BMI influence the anatomy of the colon by using three-dimensional reconstructions of the colon from CT scans, further evaluating whether any potential changes could be measured and analyzed.
The anatomical variability of the colon is well known in terms of the length of its segments and their different disposition. (2,3) Embryonic development explains this variability. The rotation of intestinal loops and the fusion of the peritoneal layers produced during the formation of mesenteries and fascial coalescence determine the location and length of the different colonic segments. (1,18) Moreover, recent anatomical studies have considered the mesentery as a distinct organ with continuity throughout the digestive tract, from the duodenum to the anorectal junction, which also influences the various morphologies observed in the colon. (19,20)
Specific radiological analysis has substantially improved anatomical study of the colon and is now considered a fundamental tool for the study of normal anatomy, modified anatomy, and pathology of this organ. (6,21) The application of three-dimensional reconstruction technology from radiological images has been an important development in this regard. This method offers improved diagnostic possibilities and permits comparative studies for evaluation of the potential influence of external factors on the anatomy of the colon. (9,22,23)
The morphometric studies of the colon described in the literature to date have generally used different measurement variables depending on the aim of the study. The Khashab group described colon segment lengths and lumen diameters through the use of virtual colonoscopy in order to evaluate the existing variability and differences based on sex, age, and BMI. (23) In our study, we have considered the anatomical reference points proposed by the Bourgouin group, (7) adding an additional bone point (PUBIS) and the points of the vascular elements (SMA and IMA), to morphometrically define the characteristics of the colon. The pubis has been considered a fixed anatomical point, although it should be borne in mind that movements of nutation and counternutation of the sacroiliac joint could cause minimal displacement of the pubis that may not be considered significant. (24,25)
Our results show that sex, age, and BMI have a significant influence on the normal anatomy of the colon, which is consistent with previous reports in the literature. The Khashab group previously reported a significantly greater total colonic length in women than in men and a significantly shorter colonic length in patients with a body mass index (BMI) greater than 25.
They did not report differences in total colon length between patients over 60 years and younger patients; however, in this group, they identified a significant difference in the length of the transverse colon. (23) The Bourgouin group suggested creating different anatomical models based on different groups related to sex, age, and BMI by digitizing the colon anatomical reference points proposed. In this study, men showed a higher and deeper hepatic flexure of the colon than women, while the splenic flexure was more lateralized, with no differences in the ICJ or in the SDJ. (7) Regarding age, there were only differences in the transverse mesocolon, which is significantly shorter in patients under 60 years of age. When studying the influence of body volume, overweight patients have previously been found to have a shorter right colon due to greater lateralization and depth of the ICJ. (7) Sex was the primary factor identified in this study, with more influence on anatomical variability, especially with the colon flexures considered as fixation elements.
All the measurements analyzed in our study were greater in men, except for the distances between the pubis and both mesenteric arteries and the angle formed by the IMA and both colon flexures. As in the studies described above (7,23) the hepatic and splenic flexures were located higher in men because of their greater distance from the pubis (using it as a fixed point); the splenic flexure was the only significantly different position. Both mesenteric arteries should be considered as being higher in women, although the IMA is the primary one responsible for significant differences compared to men.
In our analysis based on age groups, there were no differences in the distances between the pubis and colon reference points, but there were differences in the angle formed by these three points. Furthermore, the correlation between age and this angle was also significant. It should therefore be understood that the fixation points of the colon at the flexures must be more lateralized in older patients; this is consistent with the proposals by the Bourgouin group, who attributed this finding to the different distributions and dispositions of intra-abdominal fat. (7,23) There were also differences in the distances when considering the vascular elements, and although the location of the origin of the mesocolon could not be considered—as it has not been measured—the distance to the vessel closest to the mesocolon (the SMA) is greater in older patients, consistent with previous studies. (7) This was confirmed by the negative correlation between age and both of the distances between the pubis and mesenteric arteries.
The influence of BMI on the anatomy of the colon described in our study is important. The stratification scheme in this study—normal weight, overweight and obese—differs from that in the previous studies mentioned, in which only two groups were considered. The normal weight and overweight group and the normal weight and obese groups showed significant differences between the pubis and ICJ and between the pubis and SDJ, with these points identified as being more lateral and deeper in more obese patients. This confirms the previous results from the Bourgouin group, which hypothesized that intra-abdominal fat is distributed in lower areas of the abdomen in obese patients. (7) Our study results differ in the disposition of the hepatic flexure of the colon as we identified differences between both groups, which have not been described in previous studies.(7,23) In fact, when analyzing the correlation between BMI and morphometric variables, we observed that there was a greater distance from the pubis to all colon reference points in more obese patients, as well as greater distance between the arteries, which could also be explained by a greater amount of intra-abdominal fat.
A potential limitation of the present study could be the proposed reconstruction method. The manual segmentation of the entire surface of the colon can result in reduced accuracy of the reconstruction and subsequent measurements, compared to image digitization and processing of the reconstruction with other software packages. (7,26,27) Nevertheless, the same working protocol was followed with all images, thus minimizing the margin of error generated in the present study.
CONCLUSION
Our study sought to combine the description and characterization of the influence of sex, age, and BMI on the anatomy of the colon with the help of three-dimensional reconstruction. The importance of this combination lies in its potential application in clinical practice and teaching. Preoperative preparation for colon surgery can be improved with this technique, like what the Tarragona group previously reported using the dimensions of the bony pelvis for laparoscopic approach to rectal tumours. (11) This method would also allow for the development of virtual anatomical models based on different patient groups, which can be used in teaching and in surgical training. (14-17) In conclusion, three-dimensional reconstructions from CT scans can aid the study of the anatomical variations and disposition of the colon between different human subjects. Sex, age, and BMI of individual patients have a significant influence on the anatomy of the colon.
ACKNOWLEDGEMENT
The authors wish to sincerely thank those who donated their bodies to science so that anatomical research could be performed. Results from such research can potentially improve patient care and increase mankind’s overall knowledge. Therefore, these donors and their families deserve our highest gratitude.
The authors thank the staff of the Department of Radiodiagnosis at the Hospital Royo Villanova of Zaragoza for their collaboration in obtaining the study images, as well as the staff of the Department of Microbiology, Preventive Medicine and Public Health at the University of Zaragoza for their help in performing statistical analyses.
FUNDING SOURCES
This research did not receive any specific grant from funding agencies in the public, commercial, or not-forprofit sectors.
BIBLIOGRAPHIC REFERENCES
- ↑Moore K, Persaud T, Torchia M. Embriología clínica. 8th ed. Elservier: Barcelona; 2008.
- ↑Mike M, Kano N. Reappraisal of the vascular anatomy of the colon and consequences for the definition of surgical resection. Dig Surg. 2013;30(4-6):383-92. DOI: 10.1159/000343156
- ↑Rouviere H, Delmas A, Delmas V. Anatomía humana: Descriptiva, topográfica y funcional. 11th ed. Elservier: Barcelona; 2005.
- ↑Hounnou G, Destrieux C, Desme J, et al. Anatomical study of the length of the human intestine. Surg Radiol Anat. 2002;24(5):290-4. DOI: 10.1007/s00276-002-0057-y
- ↑Hunter A, Eisma R, Lamb C. Thiel embalming fluid-a new way to revive formalin-fixed cadaveric specimens. Clin Anat . 2014;27(6):853-5. DOI: 10.1002/ca.22392
- ↑Ramachandran I, Rodgers P, Elabassy M, et al. Multidetector computed tomography of the mesocolon: Review of anatomy and pathology. Curr Probl Diagn Radiol. 2009;38(2):84-90. DOI: 10.1067/j.cpradiol.2007.11.005
- ↑Bourgouin S, Bege T, Lalonde N, et al. Three-dimensional determination of variability in colon anatomy: Applications for numerical modeling of the intestine. J Surg Res. 2012;178(1):172-80. DOI: 10.1016/j.jss.2012.03.054
- ↑Hirai K, Yoshinari D, Ogawa H, et al. Three-dimensional computed tomography for analyzing the vascular anatomy in laparoscopic surgery for right-sided colon cancer. Surg Laparosc Endosc Percutan Tech. 2013;23(6):536-9. DOI: 10.1097/SLE.0b013e31828f66fb
- ↑Hong D, Tavanapong W, Wong J, et al. 3D Reconstruction of virtual colon structures from colonoscopy images. Comput Med Imaging Graph. 2014;38(1):22-33. DOI: 10.1016/j.compmedimag.2013.10.005
- ↑Mark EB, Poulsen JL, Haase AM, et al. Assessment of colorectal length using the electromagnetic capsule tracking system: A comparative validation study in healthy subjects. Colorectal Dis. 2017;19(9):O350-O357. DOI: 10.1111/codi.13810
- ↑Targarona EM, Balague C, Pernas JC, et al. Can we predict immediate outcome after laparoscopic rectal surgery? Multivariate analysis of clinical, anatomic, and pathologic features after 3-dimensional reconstruction of the pelvic anatomy. Ann Surg. 2008;247(4):642-9. DOI: 10.1097/SLA.0b013e3181612c6a
- ↑Killeen T, Banerjee S, Vijay V, et al. Magnetic resonance (MR) pelvimetry as a predictor of difficulty in laparoscopic operations for rectal cancer. Surg Endosc. 2010;24(12):2974-9. DOI: 10.1007/s00464-010-1075-1
- ↑Szura M, Pasternak A, Solecki R, et al. Accuracy of preoperative tumor localization in large bowel using 3D magnetic endoscopic imaging: Randomized clinical trial. Surg Endosc. 2017;31(5):2089-2095. DOI: 10.1007/s00464-016-5203-4
- ↑Trelease RB, Rosset A. Transforming clinical imaging data for virtual reality learning objects. Anat Sci Educ. 2013;6(4):263-70. DOI: 10.1002/ase.13
- ↑Mavar-Haramija M, Prats-Galino A, Mendez JA, et al. Interactive 3D-PDF presentations for the simulation and quantification of extended endoscopic endonasal surgical approaches. J Med Syst. 2015;39(10):127. DOI: 10.1007/s10916-015-0282-7
- ↑Prats-Galino A, Reina MA, Haramija MM, et al. 3D interactive model of lumbar spinal structures of anesthetic interest. Clin Anat. 2015;28(2):205-12. DOI: 10.1002/ca.22479
- ↑Jones DB, Sung R, Weinberg C, et al. Three-dimensional modeling may improve surgical education and clinical practice. Surg Innov. 2016;23(2):189-95. DOI: 10.1177/1553350615607641
- ↑Jeong YJ, Cho BH, Kinugasa Y, et al. Fetal topohistology of the mesocolon transversum with special reference to fusion with other mesenteries and fasciae. Clin Anat. 2009;22(6):716-29. DOI: 10.1002/ca.20846
- ↑Coffey JC, Dillon M, Sehgal R, et al. Mesenteric-based surgery exploits gastrointestinal, peritoneal, mesenteric and fascial continuity from duodenojejunal flexure to the anorectal junction-A review. Dig Surg. 2015;32(4):291-300. DOI:10.1159/000431365
- ↑Coffey JC, O’Leary DP. The mesentery: Structure, function, and role in disease. Lancet Gastroenterol Hepatol. 2016;1(3):238-247. DOI: 10.1016/S2468-1253(16)30026-7
- ↑Madiba TE, Haffajee MR, Sikhosana MH. Radiological anatomy of the sigmoid colon. Surg Radiol Anat. 2008;30(5):409-15. DOI: 10.1007/s00276-008-0344-3
- ↑Iafrate F, Rengo M, Ferrari R, et al. Spectrum of normal findings, anatomic variants and pathology of ileocecal valve: CT colonography appearances and endoscopic correlation. Abdom Imaging. 2007;32(5):589-95. DOI:10.1007/s00261-007-9198-0
- ↑Khashab MA, Pickhardt PJ, Kim DH, et al. Colorectal anatomy in adults at computed tomography colonography: Normal distribution and the effect of age, sex, and body mass index. Endoscopy. 2009;41(8):674-8. DOI: 10.1055/s-0029-1214899
- ↑Vleeming A, Schuenke MD, Masi AT, et al.. The sacroiliac joint: An overview of its anatomy, function and potential clinical implications. J Anat. 2012;221(6):537-67. DOI: 10.1111/j.1469-7580.2012.01564.x
- ↑Cibulka M. Anatomy of the sacroiliac joints. J Anat. 2013;222(3):390. DOI: 10.1111/joa.12019
- ↑Shin DS, Park JS, Chung MS. Three types of the serial segmented images suitable for surface reconstruction. Anat Cell Biol. 2012;45(2):128-35. DOI: 10.5115/acb.2012.45.2.128
- ↑Shin DS, Chung MS, Shin BS, et al. Laparoscopic and endoscopic exploration of the ascending colon wall based on a cadaver sectioned images. Anat Sci Int. 2014;89(1):21-7. DOI: 10.1007/s12565-013-0191-0
ARTICLE INFORMATION
Conflicts of interests: The authors of this article declare that they have no conflict of interest with respect to what is stated in this work.
Corresponding: José Fernando. Servicio de Cirugía General y de Aparato Digestivo. Hospital Royo Villanova. Avda. San Gregorio, 30 · 50015 Zaragoza. E-mail: jftrebolle@gmail.com