
Original
Choroidal thickness analysis in keratoconus patients
Análisis del espesor coroideo en pacientes con queratocono
Actual Med. 2021; 106(814): 252-259 DOI: 10.15568/am.2021.814.or02
Recibido: 05/03/2021
Revisado: 01/05/2021
Aceptado: 03/09/2021
ABSTRACT
Objective. To determine and compare choroidal thickness (CT) in keratoconus (KC) patients using Enhanced Depth Imaging (EDI) OCT.
Methods. A comparative cross-sectional study including 26 patients with KC and 26 healthy controls assessed with Pentacam and EDI-OCT. CT was measured manually with the Caliper function at thirteen locations at 500 µm regular intervals.
Results. The average CT in T6 was 253.96 ± 88.95 μm in the KC group, and of 309.39 ± 94.11 μm in the control group (p <0.041). No significant differences in mean CT were observed in the rest of the points, including the subfoveal CT (M), 351.48 ± 106.3 vs 365.35 ± 114.6 μm, (p = 0.66). No correlation was observed between the mean subfoveal CT (M), the mean CT in the KC group, and the values of K1 (p = 0.977 and p = 0.498 respectively), K2 (p = 0.450 and p = 0.656), corneal asphericity (Q ) (p = 0.986 and p = 0.902), minimal pachymetry (Pachy) (p = 0.408 and p = 0.688), keratoconus index (KI) (p = 0.601 and p = 0.217), vertical asymmetry index (VAT) (p = 0.296 and p = 0.523), staging of KC (TKC) (p = 0.549 and p = 0.08) and corneal apex morphology.
Conclusion. Significant lower CT was found in the KC group in T6 (3000 μm temporal to the fovea). No significant difference of CT values in KC patients and healthy subjects was found in the other twelve measurement locations.We found no association between the refractive and keratometric indexes obtained by corneal topography and subfoveal CT.
Keywords: Choroidal thickness; Keratoconus; Inflammation; Choroid; Optical coherence Tomography; EDI-OCT.
RESUMEN
Objetivo. Determinar y comparar el grosor de la coroides (CT) en pacientes con queratocono (KC) usando OCT con Enhanced Depth Imaging (EDI).
Métodos. Estudio comparativo transversal que incluye 26 pacientes con KC y 26 controles sanos evaluados con Pentacam y EDI-OCT. El KC fue medido manualmente con la función Caliper en trece puntos a intervalos regulares de 500 µm.
Resultados. El promedio de CT en T6 fue de 253,96 ± 88,95 μm en el grupo KC, y de 309,39 ± 94,11 μm en el grupo de control (p <0,041). No se observaron diferencias significativas en la media de CT en el resto de los puntos, incluyendo el CT subfoveal (M), 351.48 ± 106.3 vs 365.35 ± 114.6 μm, (p = 0.66). No se observó ninguna correlación entre la media de CT (M) subfoveal, la media de CT en el grupo KC, y los valores de K1 (p = 0,977 y p = 0,498 respectivamente), K2 (p = 0,450 y p = 0,656), la asfericidad corneal (Q) (p = 0,986 y p = 0. 902), paquimetría mínima (Pachy) (p = 0,408 y p = 0,688), índice de queratocono (KI) (p = 0,601 y p = 0,217), índice de asimetría vertical (VIA) (p = 0,296 y p = 0,523), estadificación del KC (TKC) (p = 0,549 y p = 0,08) y morfología del ápice corneal.
Conclusión. Se observó un CT significativamente menor en el grupo KC en T6 (3000 μm temporal a la fóvea). No se encontraron diferencias significativas entre los valores del CT en los pacientes con KC y en los sujetos sanos en los 12 puntos de medida restantes. No se encontró ninguna asociación entre los índices refractivos y queratométricos obtenidos por la topografía corneal y el CT subfoveal.
Palabras clave: Grosor coroideo; Queratocono; Inflamación; Coroides; Tomografía de coherencia óptica; EDI-OCT.
Leer Artículo Completo
INTRODUCTION
Keratoconus (KC) is an ectatic corneal disease. It has been traditionally defined as non-inflammatory (1), although recent studies (2) (3) reject this hypothesis. It is characterized by a progressive thinning of the corneal thickness, with a consequent alteration of corneal biomechanics, generating an irregular astigmatism. KC is a complex pathology, based on the interaction of genetics and environmental factors. It also represents one of the main causes of keratoplasty today(4).
Recent studies show increased levels of inflammatory cytokines and proteolytic enzymes including interleukin 1 and 6 (5), Intercellular Adhesion Molecule (ICAM-1), tumoral necrotic factor-alpha (TNF-α) and vascular cell adhesion protein one (VCAM-1) (6). These inflammatory mediators activate an enzymatic cascade that increases the level of metalloproteases(7), triggering ectasia on the corneal matrix. These inflammatory alterations in the anterior segment could be related to an enhanced vascular flow in adjacent tissues such as the choroid, all which leads to a thicker choroid in KC patients. Our purpose was to evaluate the choroidal thickness (CT) in keratoconus patients and compare it to healthy controls.
MATERIAL AND METHODS
Study design
This is a cross-sectional, comparative study between groups, to evaluate the choroidal thickness of patients with KC. 26 eyes of 26 patients without ocular pathologies different from KC were included and assessed by corneal tomography analysis (Pentacam® HR, OCULUS, Optikgeräte GmbH, Wetzlar, Germany) and EDI SD-OCT using Spectralis® Heildelberg® (Germany). The results were compared to 26 healthy eyes of 26 patients (control group). This study was approved by the ethics committee of Hospital Universitario Reina Sofia de Murcia, and is adhered to the tenets of the Declaration of Helsinki.
Scanning
Participants underwent a complete ophthalmological examination including: refraction, best corrected visual acuity (BCVA), Perkins applanation tonometry, slit lamp biomicroscopy, fundoscopy under tropicamide dilation, spectral domain optical coherence tomography (SD-OCT) with enhanced deep imaging (EDI) Spectralis® (Heidelberg Engineering, Germany) and corneal topographic examination with Pentacam HR® (Oculus Optikgeräte GmbH, Germany).
Inclusion and exclusion criteria
The inclusion criteria were both clinical and topographic diagnosis of KC. One eye was randomly selected in case of bilateral disease. Patients with history of previous eye trauma, glaucoma, infectious or inflammatory eye disease, systemic disease or previous intraocular surgery were excluded from the study. Those who had undergone corneal cross-linking less than twelve months prior to the study were also excluded
Patients without ocular or systemic pathology, with BCVA of 20/20, were randomly selected as controls. As myopia is related to thinner choroidal thickness, individuals with ± 2 D of spherical equivalent were excluded from the control group.
Instruments
Topographic and pachymetric criteria of normality were checked in healthy controls with Oculus Pentacam (®HR, Germany). In the KC group, keratometry, pachymetry, corneal asphericity index, keratoconus index (KI), vertical asymmetry index (VIA), degree of keratoconus (TKC) and location of the corneal apex (central, inferior-nasal, inferior-temporal or upper) was also analyzed.
Choroidal thickness (CT) measurements were performed with the Enhanced Depth Imaging (EDI) EDI-OCT Spectralis® from Heidelberg, Germany. It was carried out by the same expert manually using the tomograph’s Caliper function and the 1:1 µm ratio. Manual measurement is reliable and has a very high interobserver and intersystem agreement(8). The evaluations were always performed in the afternoon (12:00 to 15:00) to minimize circadian variation. The subfoveal CT (M) was obtained measuring perpendicularly the distance between the posterior limit of the retinal pigment epithelium (RPE) and the choroid-scleral junction just below the fovea. Twelve further CT measurements were assessed every 500 µm; six temporal and six nasal to the fovea (Fig. 1).
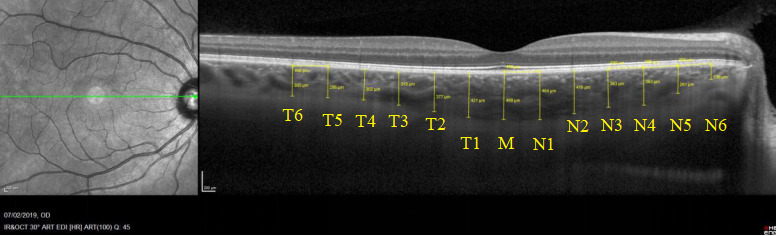
Figure 1. Subfoveal CT (M) was obtained measuring manually the perpendicular distance between the posterior limit of the retinal pigment epithelium (RPE) and the choroid-scleral junction just below the fovea. Twelve further CT measurements were performed every 500 μm; six temporal (T1-T6) and six nasal (N1-N6) to the fovea.
Statistical analysis
Statistical analysis was calculated using Statistical Package for the Social Sciences (Version 24.0, SPSS, Chicago IL, USA). Initially, a descriptive study of each of the included variables was performed. The t-student test for independent samples was used to compare the quantitative variables of choroidal thickness of both groups. Statistical significance was considered as p<0.05. For the correlation between variables, we initially used tests of normality between them. To check the association between two quantitative variables we used the Pearson’s test if the distribution was normal, or the Spearman’s test if it was not normalized. To check the association between a quantitative and a categorical variable, the analysis of variance ANOVA was required. Measurements of the thirteen locations are expressed in microns (μm), and are composed of the mean value plus/minus the standard deviation.
RESULTS
The mean age in the KC group was 34.12 ± 12 years-old (y.o) (range; 12 to 63 y.o) and in the control group 39.6 ± 14.6 y.o (range; 19 to 80 y.o). No significant differences were found in age distribution (p=0.073) (Table 1). Female/male ratio represented 13/13 (50/50%) in the KC group and 18/8(69/31%) in the control group. These differences did not reach statistical significance (p=0.23).
The mean BCVA was 0.69 ± 0.30 in the KC group and 0.99 ± 0.04 in the control group. BCVA was firstly measured with letter optotypes on a decimal scale and transformed later to the log MAR (minimal angle of resolution). Statistically significant differences were observed for BCVA between both groups (p < 0.001) (Table 1).
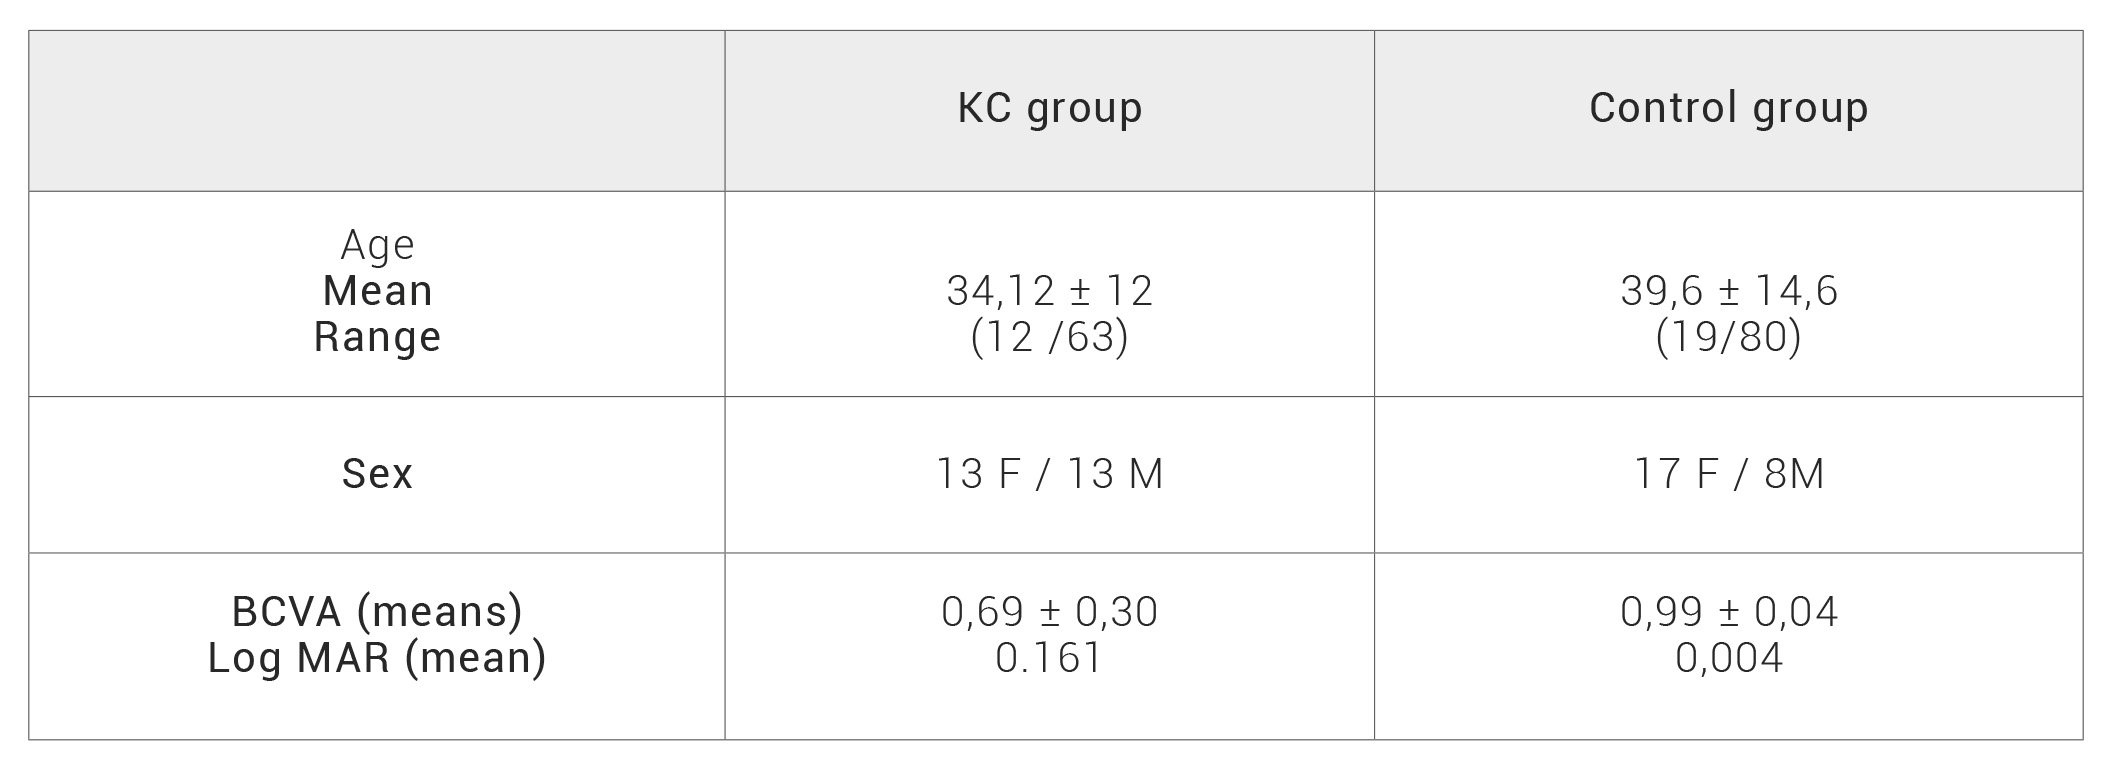
Table 1. KC: keratoconus, F: female, M: male, BCVA: best corrected visual acuity, MAR: minimum angle of resolution
CT reached its highest values in the subfoveal zone in both groups, and decreased progressively towards the periphery (Figure 2). CT was thinner in the nasal points. No significant differences were found in subfoveal CT (M) (351.48 ± 106.3 μm in the KC group and 365.35 ± 114.6 μm in the control group) (p=0.66). Significant lower CT was found in the KC in T6 (253.96 ± 88.95 μm and 309.39 ± 94.11 μm) (p<0,041). The other twelve studied locations did not reach significant differences between both groups. These results are summarized in Figure 2,3,4 and Table 2. All the CT measurements (13 locations), were higher in the control group, although statistically significant difference was only observed in T6, located 3000 μm temporal to the fovea. It was a surprise to find higher values in the control group, contrarily to our expectations based on the inflammatory theory of KC.
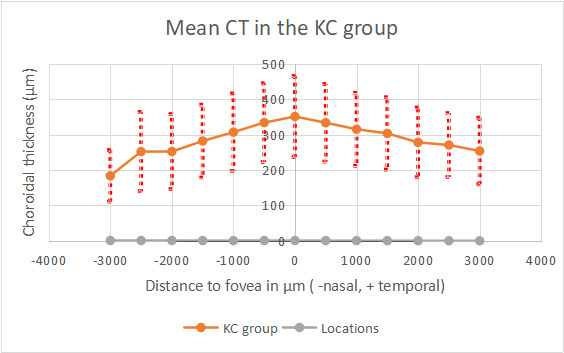
Figure 2.
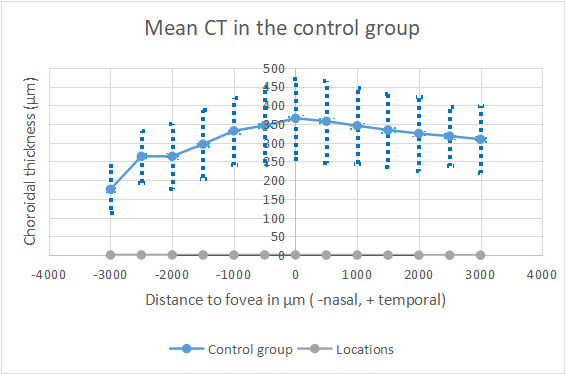
Figure 3.
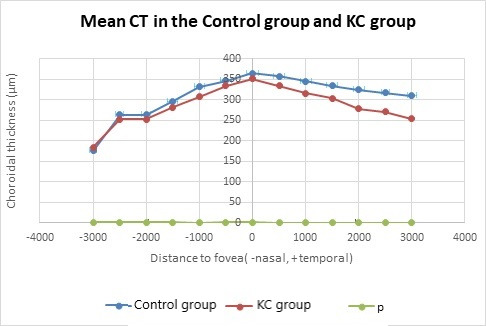
Figure 4.
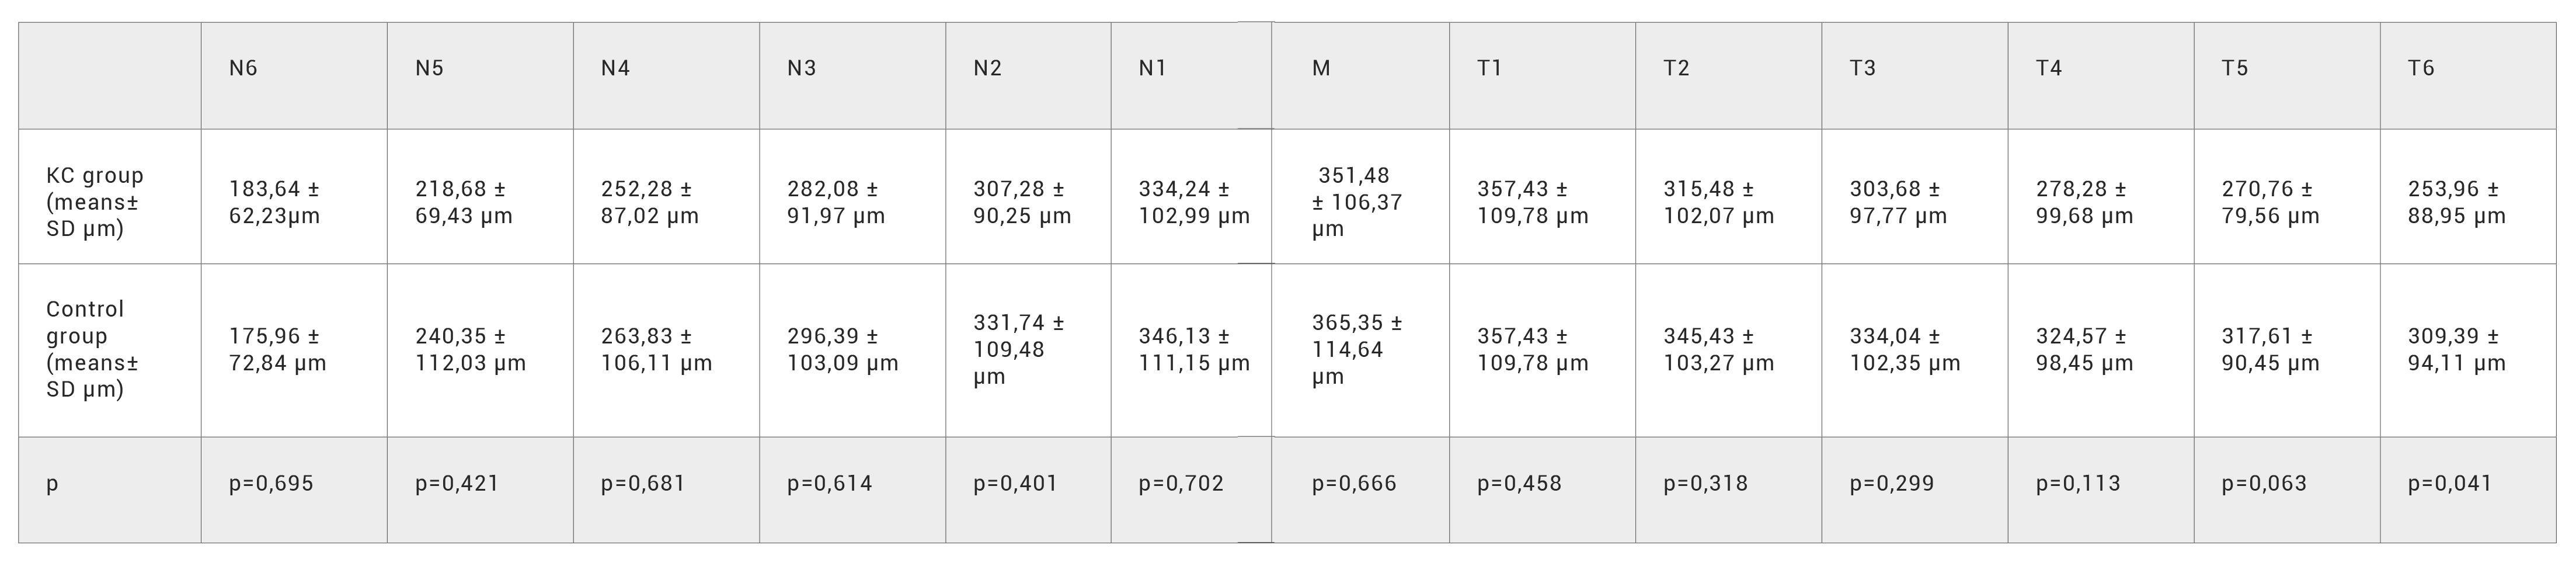
Table 2. Mean choroidal thickness measurements in both groups. Significant difference was only observed in T6.
CT: choroidal thickness, K: keratoconus, p: values from independent t-test, N: nasal, M: subfoveal choroidal thickness, T: temporal.
No correlation was observed between anterior segment parameters and mean subfoveal CT (M) in the KC group (Table 3). Correlation between M and: Q (r=- 0.004, p=0.408), KI (r=-0.110, p=0.601) and VIA (r=-0.218, p=0.269) was not detected (using Pearson test). Correlations between M and KM (r=0.040, p=0.848) and pachymetry (r=-0.173, p=0.408) was neither significant (using Spearman test).
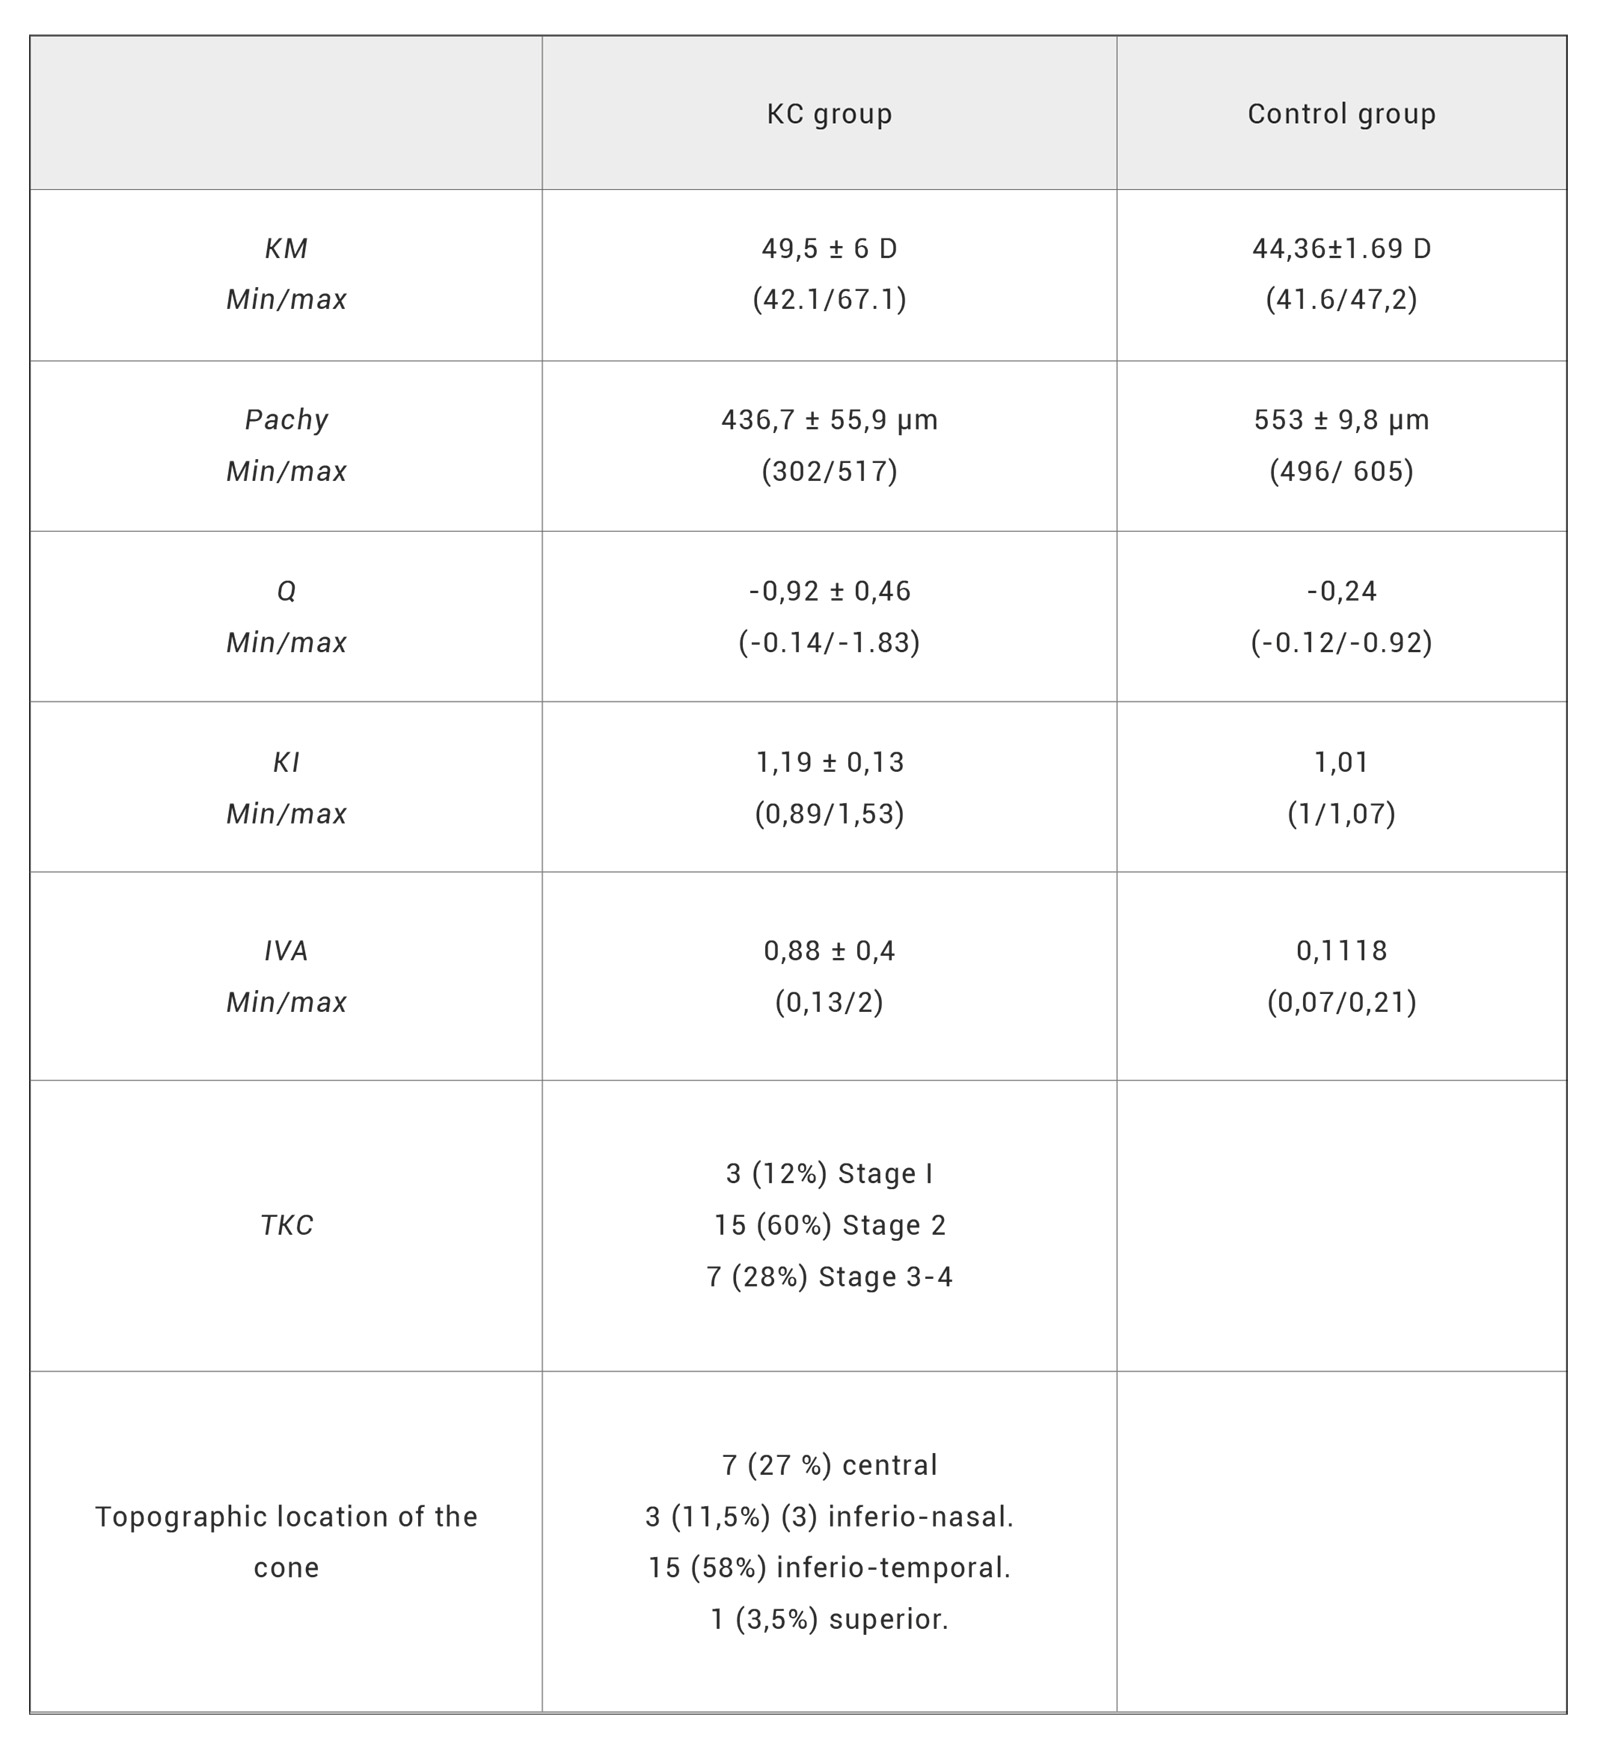
Table 3. Corneal parameters in both groups.
KC: keratoconus, KI: keratoconus index, KM: mean corneal curvature, Pachy :minimal pachymetry, Q: corneal asphericity, TKC: staging of KC and VIA: index of vertical asymmetry.
DISCUSSION
The choroid is being studied profusely nowadays using SS-OCT and EDI OCT. Anatomical choroidal alterations have been identified in different inflammatory eye disorders such as: as ankylosing spondylitis, psoriasis (9), Vogt-Koyanagi-Harada syndrome(10), Behçet´s disease (11), posterior scleritis (12) and sympathetic ophthalmia (13). It has also been linked to other inflammatory
diseases with no ocular manifestations (14). KC is no longer considered a non-inflammatory disease (1) (15) (16), it has been associated with increased levels of proinflammatory cytokines (17) and cell adhesion molecules and metalloproteases (7). Oxidative stress has also been identified to play a role in the genesis of the disease (16) (18) (19). Consequently, we aimed to study the choroid of KC patients following this inflammation theory.
Corneal stroma is composed of type I, III, V, VI and XII collagen fibers(16) (20). KC is related to connective tissue disorders (21) such as Ehler-Danlos syndrome (22), pseudoxanthoma elasticum, osteogenesis imperfecta (23) and mitral valve prolapse (24). Collagen type I is an important component of vascular vessels, so corneal alterations in KC eyes could be accompanied by structural changes in the choroid, which is a highly vascularized tissue.
The most accepted hypothesis of the genesis of KC nowadays is the influence of certain environmental stimuli, which would act over structural alterations or predispositions of unknown origin (25). These predispositions may be based on different ethnic (26) (27), geographic (28) (29), climatic and or genetic factors (30) (31). Environmental stimuli that trigger KC disease include eye rubbing (32), contact lens wearing (6), rosacea, atopy (33) and UV light exposure (34). The progression of the disease could be the result of a complex interaction of all these mentioned factors with multiple genes with variable penetrance. Inflammation, cellular hypersensitivity and oxidative stress could initiate a vicious circle, expressing degrading enzymes (cathepsins) and metalloproteases, resulting in an imbalance between collagenolysis and collagenogenesis and decreased matrix regeneration leading to corneal ectasia.
Gutiérrez-Bonet et al.(25), observed using SS-OCT thicker choroids in KC patients than in healthy patients (an average increase of 34%, p<0,05), being these differences lower in elder patients (>45 y.o, non- significant increase, p=0,37). Akkaya et al.(35) using EDI SD-OCT instead, reached similar results. On the contrary Yilmax et al.(36) did not find significant differences in the choroidal thickness of pediatric patients with KC versus age-related controls (mean age of 12 y.o). In a recent controlled, cross-sectional study, Pinheiro-Costa et al.(37) found significant thicker choroids in KC patients (mean difference of 67,55 μm), with a large sample size and relatively young patients (range 12-30 y.o).
Akkaya et al. attributed higher subfoveal CT in KC eyes to ethnicity and age; the average age of his patients was very low (24,5 y.o; range 13-38 y.o). Margolis et al. (38) reported a decrease of 15,6 μm every decade of life, denoting the importance of age in CT measurement. Whereas Gutiérrez-Bonet et al. (25) highlighted that his results could not only be justified by collagen alteration but other factors like age, refraction, axial length, hematological causes, choroidal melanocitosis and pachychoroid-spectrum disorders. On the same line he found no significant differences above 45 y.o, possibly due to the progressive thinning of the choroid.
Despite our original supposition, our thirteen CT values were lower in the KC group than in the healthy controls. CT in healthy controls was statistically thicker (310 μm) in T6 (3mm temporal to the fovea) than in the KC group (254 μm). These results disagree with those obtained by Akkaya et al (35), Gutiérrez-Bonet et al (25). and Joao et al (37). The higher CT values were found beneath the fovea in both groups, matching these three previous studies. 68% of the healthy eyes exceeded 300 μm of CT and 36% exceeded 400 µm in M. Both limits of CT are within normal CT range. Regarding these results and contrary to expectations, no evidence of thicker CT in KC patients was found in our study. Although T6 reached significant difference, in our opinion it alone cannot justify real differences. T6 is a very eccentric point, and real differences should be regarded in more locations and specially those closer to the fovea.
When we analyzed topographic and keratometric variables in KC eyes, we do not find any correlation between them with subfoveal CT. There was neither correlation between the staging of KC, nor between the topographic location of the cone apex with subfoveal CT. The location of the cone in the KC group was similar to previous literature, being the inferior- temporal the most common location of the apex (58%) and the upper cones (3,5%) the least one.
The main limitation of our study was the low sample size. CT was measured manually by the same explorer as in the three mentioned similar studies. All measurements were performed during the afternoon (between 12-15 am) to minimize the possible impact of circadian rhythms. The device used was EDI-OCT optical coherence tomography available at our center, which is considered comparable to Swept Source (SS) OCT in CT measurement (correlation coefficient 0.975) Only one random eye was included in the control group and in case of bilateral KC. In both groups, subjects with a refractive error of ± 2 D spherical equivalent were discarded. No other possible bias that could affect the choroidal vessels such as smoking habit or microvascular pathologies were discussed.
CONCLUSION
In conclusion, KC is a complex disease whose exact etiology and development are still not fully understood. In this preliminary study we have not been able to validate a possible correlation between KC and CT. Further studies, with larger samples and comparable parameters, are therefore necessary to shed more light on this corneal ectasia. New generation non-invasive diagnostic methods of the retina and the choroid (SS- OCT and EDI-OCT) offer us a new pathway of research study the possible relationship between the structure of the choroid and corneal diseases.
BIBLIOGRAPHIC REFERENCES
- ↑Galvis V, Sherwin T, Tello A, Merayo J, Barrera R, Acera Keratoconus: An inflammatory disorder? Eye (Basingstoke). Nature Publishing Group; 2015 Jul;29(7):843–859. DOI: 10.1038/eye.2015.63
- ↑Lema I, Brea D, Rodríguez-González R, Díez-Feijoo E, Sobrino Proteomic analysis of the tear film in patients with keratoconus. Mol Vis. 2010;16:2055–61.
- ↑Jun AS, Cope L, Speck C, Feng X, Lee S, Meng H, et Subnormal cytokine profile in the tear fluid of keratoconus patients. PLoS One. 2011 Jan 27;6(1):e16437. DOI: 10.1371/journal.pone.0016437
- ↑Davidson AE, Hayes S, Hardcastle AJ, Tuft The pathogenesis of keratoconus. Eye. 2014;28(2):189–95. DOI: 10.1038/eye.2013.278
- ↑Zhou L, Yue BYJT, Twining SS, Sugar J, Feder RS. Expression of wound healing and stress-related proteins in keratoconus corneas. Curr Eye 1996;15(11):1124–1131. DOI: 10.3109/02713689608995144
- ↑Lema I, Durán JA, Ruiz C, Díez-Feijoo E, Acera A, Merayo Inflammatory response to contact lenses in patients with keratoconus compared with myopic subjects. Cornea. 2008 Aug;27(7):758–63. DOI: 10.1097/ico.0b013e31816a3591
- ↑Collier SA. Is the corneal degradation in keratoconus caused by matrix-metalloproteinases? 29, Clinical and Experimental Ophthalmology. Blackwell Publishing; 2001. p. 340–4. DOI: 10.1046/j.1442-9071.2001.d01-17.x
- ↑Sezer T, Altınışık M, Koytak İA, Özdemir MH. The choroid and optical coherence Turk Oftalmoloiji Dergisi. Turk J Ophthalmol; 2016 Jan; 46(1)30–37. DOI: 10.4274/tjo.10693
- ↑Li KZ, Tan Evaluation of choroidal thickness in psoriasis using spectral-domain optical coherence tomography. Int Ophthalmol. 2018 Apr; 38(2)417–8. DOI: 10.1007/s10792-017-0527-1
- ↑Fong AHC, Li KKW, Wong Choroidal evaluation using enhanced depth imaging spectral-domain optical coherence tomography in Vogt-Koyanagi-Harada disease. Retina. 2011 Mar;31(3):502–509. DOI: 10.1097/iae.0b013e3182083beb
- ↑Ishikawa S, Taguchi M, Muraoka T, Sakurai Y, Kanda T, Takeuchi Changes in subfoveal choroidal thickness associated with uveitis activity in patients with Behçet’s disease. Br J Ophthalmol. 2014 Nov 1;98(11):1508–1513. DOI: 10.1136/bjophthalmol-2014-305333
- ↑Hirukawa K, Keino H, Watanabe T, Okada AA. Enhanced depth imaging optical coherence tomography of the choroid in new-onset acute posterior scleritis. Vol. 251, Graefes Arch Clin Exp Ophthalmol. 2013 Sep; 251(9): 2273–2275. DOI: 10.1007/s00417-013-2265-z
- ↑Fleischman D, Say EAT, Wright JD, Landers Multimodality diagnostic imaging in a case of sympathetic ophthalmia. Ocul Immunol Inflamm. 2012 Aug;20(4)300–302. DOI: 10.3109/09273948.2012.682637
- ↑Ferreira CS, Beato J, Falcão MS, Brandão E, Falcão-Reis F, Carneiro ÂM. Choroidal thickness in multisystemic autoimmune diseases without ophthalmologic manifestations. 2017 Mar;37(3): 529–535. DOI: 10.1097/iae.0000000000001193
- ↑McMonnies Inflammation and keratoconus. Optom Vis Sci. 2015 feb;92(2)35-41. DOI: 10.1097/opx.0000000000000455
- ↑Boote C, Kamma-Lorger CS, Hayes S, Harris J, Burghammer M, Hiller J, et al. Quantification of collagen organization in the peripheral human cornea at micron-scale resolution. Biophys J. 2011 Jul 6;101(1):33–42. DOI: 10.1016/j.bpj.2011.05.029
- ↑Balasubramanian SA, Pye DC, Willcox Are proteinases the reason for keratoconus. Curr Eye Res; 2010 Mar;35(3)185-191. DOI: 10.3109/02713680903477824
- ↑Wojcik KA, Kaminska A, Blasiak J, Szaflik J, Szaflik Oxidative stress in the pathogenesis of keratoconus and Fuchs endothelial corneal dystrophy. Vol. 14, Int J Mol Sci. 2013; 14(9):19294–19308. DOI: 10.3390/ijms140919294
- ↑Toprak I, Kucukatay V, Yildirim C, Kilic-Toprak E, Kilic-Er-kek O. Increased systemic oxidative stress in patients with keratoconus. 2014;28(3):285–9. DOI: 10.1038/eye.2013.262
- ↑Marshall GE, Konstas AG, Lee WR. Immunogold fine structural localization of extracellular matrix components in aged human cornea Collagen types V and VI. Graefe’s Arch Clin Exp Ophthalmol. 1991;229(2):164–71. DOI: 10.1007/bf00170550
- ↑Rabinowitz Keratoconus. Sur Ophthalmol 1998. 42(4): 297319. DOI: 10.1016/S0039-6257(97)00119-7
- ↑McDermott ML, Holladay J, Liu D, Puklin JE, Shin DH, Cowden JW. Corneal topography in Ehlers-Danlos syndrome. J Cataract Refract Surg. 1998;24(9):1212–5. DOI: 1016/s0886-3350(98)80013-8
- ↑Beckh U, Schonherr U, Naumnnn GOH. Autosomal inherited keratoconus as an ocular symptom of osteogenesis imperfecta tarda Lobstein. Klin Monbl Augenheilkd. 1995 Apr 8;206(4):268–72. DOI: 1055/s-2008-1035438
- ↑Lichter H, Loya N, Sagie A, Cohen N, Muzmacher L, Yassur Y, et al. Keratoconus and mitral valve Am J Ophthalmol. 2000;129(5):667–8. DOI: 10.1016/s0002-9394(00)00371-8
- ↑Gutierrez-Bonet R, Ruiz-Medrano J, Peña-Garcia P, Catanese M, Sadeghi Y, Hashemi K, et al. Macular choroidal thickening in keratoconus patients: Swept-source optical coherence tomography Transl Vis Sci Technol. 2018 May 1;7(3):15–15. DOI: 10.1167/tvst.7.3.15
- ↑Gokhale Epidemiology of keratoconus. In: Indian J Ophthalmol. Medknow Publications and Media Pvt. Ltd.; 2013. Aug; 61(8)382–383. DOI: 10.4103/0301-4738.116054
- ↑Hashemi H, Khabazkhoob M, Yazdani N, Ostadimoghaddam H, Norouzirad R, Amanzadeh K, et al. The prevalence of keratoconus in a young population in Mashhad, Iran. Ophthalmic Physiol 2014;34(5):519–27. DOI: 10.1111/opo.12147
- ↑Jonas JB, Nangia V, Matin A, Kulkarni M, Bhojwani Prevalence and Associations of Keratoconus in Rural Maharashtra in Central India: The Central India Eye and Medical Study. Am J Ophthalmol. 2009 Nov;148(5):760– 5. DOI: 10.1016/j.ajo.2009.06.024
- ↑Assiri AA, Yousuf BI, Quantock AJ, Murphy PJ, Assiri Incidence and severity of keratoconus in Asir province, Saudi Arabia. Br J Ophthalmol. 2005 Nov;89(11):1403–6. DOI: 10.1136/bjo.2005.074955
- ↑Wang Y, Rabinowitz YS, Rotter JI, Yang Genetic epidemiological study of keratoconus: Evi- dence for major gene determination. Am J Med Genet. 2000 Aug 28;93(5):403–9. DOI: 10. 1002/1096-8628( 20000828)93:5<403::AID-AJM-G11>3.0.CO;2-A
- ↑Li X, Rabinowitz YS, Tang YG, Picornell Y, Taylor KD, Hu M, et Two-stage genome-wide linkage scan in kera- toconus sib pair families. Investig Ophthalmol Vis Sci. 2006 Sep 1;47(9):3791–5. DOI: 10.1167/iovs.06-0214
- ↑McMonnies Abnormal rubbing and keratectasia. Eye Contact Lens. 2007. 33(6)265–271. DOI: 10.1097/icl.0b013e31814fb64b
- ↑Harrison RJ, Klouda PT, Easty DL, Manku M, Charles J, Stewart Association between keratoconus and atopy. Br J Ophthalmol. 1989 Oct 1;73(10):816–22. DOI: 10.1136/bjo.73.10.816
- ↑McMonnies CW, Korb DR, Blackie The role of heat in rubbing and massage-related corneal deformation. Vol. 35, Contact Lens and Anterior Eye. 2012. p. 148–54. Available from: DOI: 10.1016/j.clae.2012.01.001
- ↑Akkaya Macular and peripapillary choroidal thickness in patients with keratoconus. Ophthalmic Surg Lasers Imaging Retin. 2018 Sep 1;49(9):664–73. DOI: 10.3928/23258160-20180831-03
- ↑Yilmaz I, Saracoglu Yilmaz B, Guleryuz NB, Perente I, Ozkaya A, Taskapili Assessment of the macula and choroid in pediatric keratoconus patients. Saudi J Ophthalmol. 2018 Apr 1;32(2):126–9. DOI: 10.1016/j.sjopt.2017.10.010
- ↑Pinheiro-Costa J, Pinto JV, Perestrelo S, Beato JN, Torrão L, Brandão E, et Increased Choroidal Thickness in Keratoconus Patients: Perspectives in the Disease Pathophysiology. J Ophthalmol. 2019 Dec 3;2019:2453931. DOI:10.1155/2019/2453931
- ↑Margolis R, Spaide A Pilot Study of Enhanced Depth Imaging Optical Coherence Tomography of the Choroid in Normal Eyes. Am J Ophthalmol. 2009 May;147(5):811–5. DOI: 10.1016/j.ajo.2008.12.008
ARTICLE INFORMATION
Conflict of interests: The authors of this article declare that they have no conflict of interest with respect to what is stated in this work.
Corresponding Author: Andrés López-Jiménez. Arquitecto Berges street, 33 · 2007, Jaén. Spain. E-mail: andreslj_2005@hotmail.com