


 67 / 64

67
José Manuel Muñoz Olmedo
Basics of isolation and cultivation of chondrocytes
Phenotype characterization of chondrocytes after first
passage (P1) was performed by flow cytometry. After detaching
cells from the tissue culture flasks, the cells were washed
twice with phosphate buffered saline solution (PBS; Invitrogen,
GIBCO, USA) supplemented with 2% FBS (Invitrogen, GIBCO,
USA). Aliquots of 100,000 cells were incubated with mouse
anti-human CD90-PE (Miltenyi Biotec Inc., USA), mouse anti-
human CD44-PE (Miltenyi Biotec Inc., USA) and mouse anti-
human CD45-FITC (Miltenyi Biotec Inc., USA) for 30 min in the
dark. Flow cytometric analysis was performed with FACSCalibur
flow cytometer (Becton Dickinson) and CellQuest software
(Becton Dickinson). Chondrocytes were considered positive for
a surface marker when the percentage of positive cells for that
surface marker was ≥ to 95% and cells were considered negative
when the percentage of positive cells for that surface marker
was ≤ to 5%. The level of marker expression was calculated as
the ratio between geometric mean fluorescence intensity of
sample cells and that of the negative control.
RESULTS
Chondrocytes isolation and morphology
Cells isolated from human cartilage after enzymatic
digestion were seeded at 75 cm
2
tissue culture flask (T75) at
density 35,000 cells⁄ cm
2
. The morphology of chondrocytes was
observed under an inverted phase contrast light microscope
(Leica DM IL). Non-adherent or few adherent small round
cells were also present in the primary culture after 4 days of
cultivation; these cells were removed with first medium change.
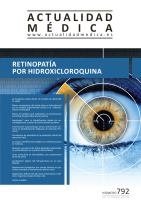
Heterogeneous population of cells with different morphology
was observed after 7 days of cultivation (Fig. 2a). After 21 days
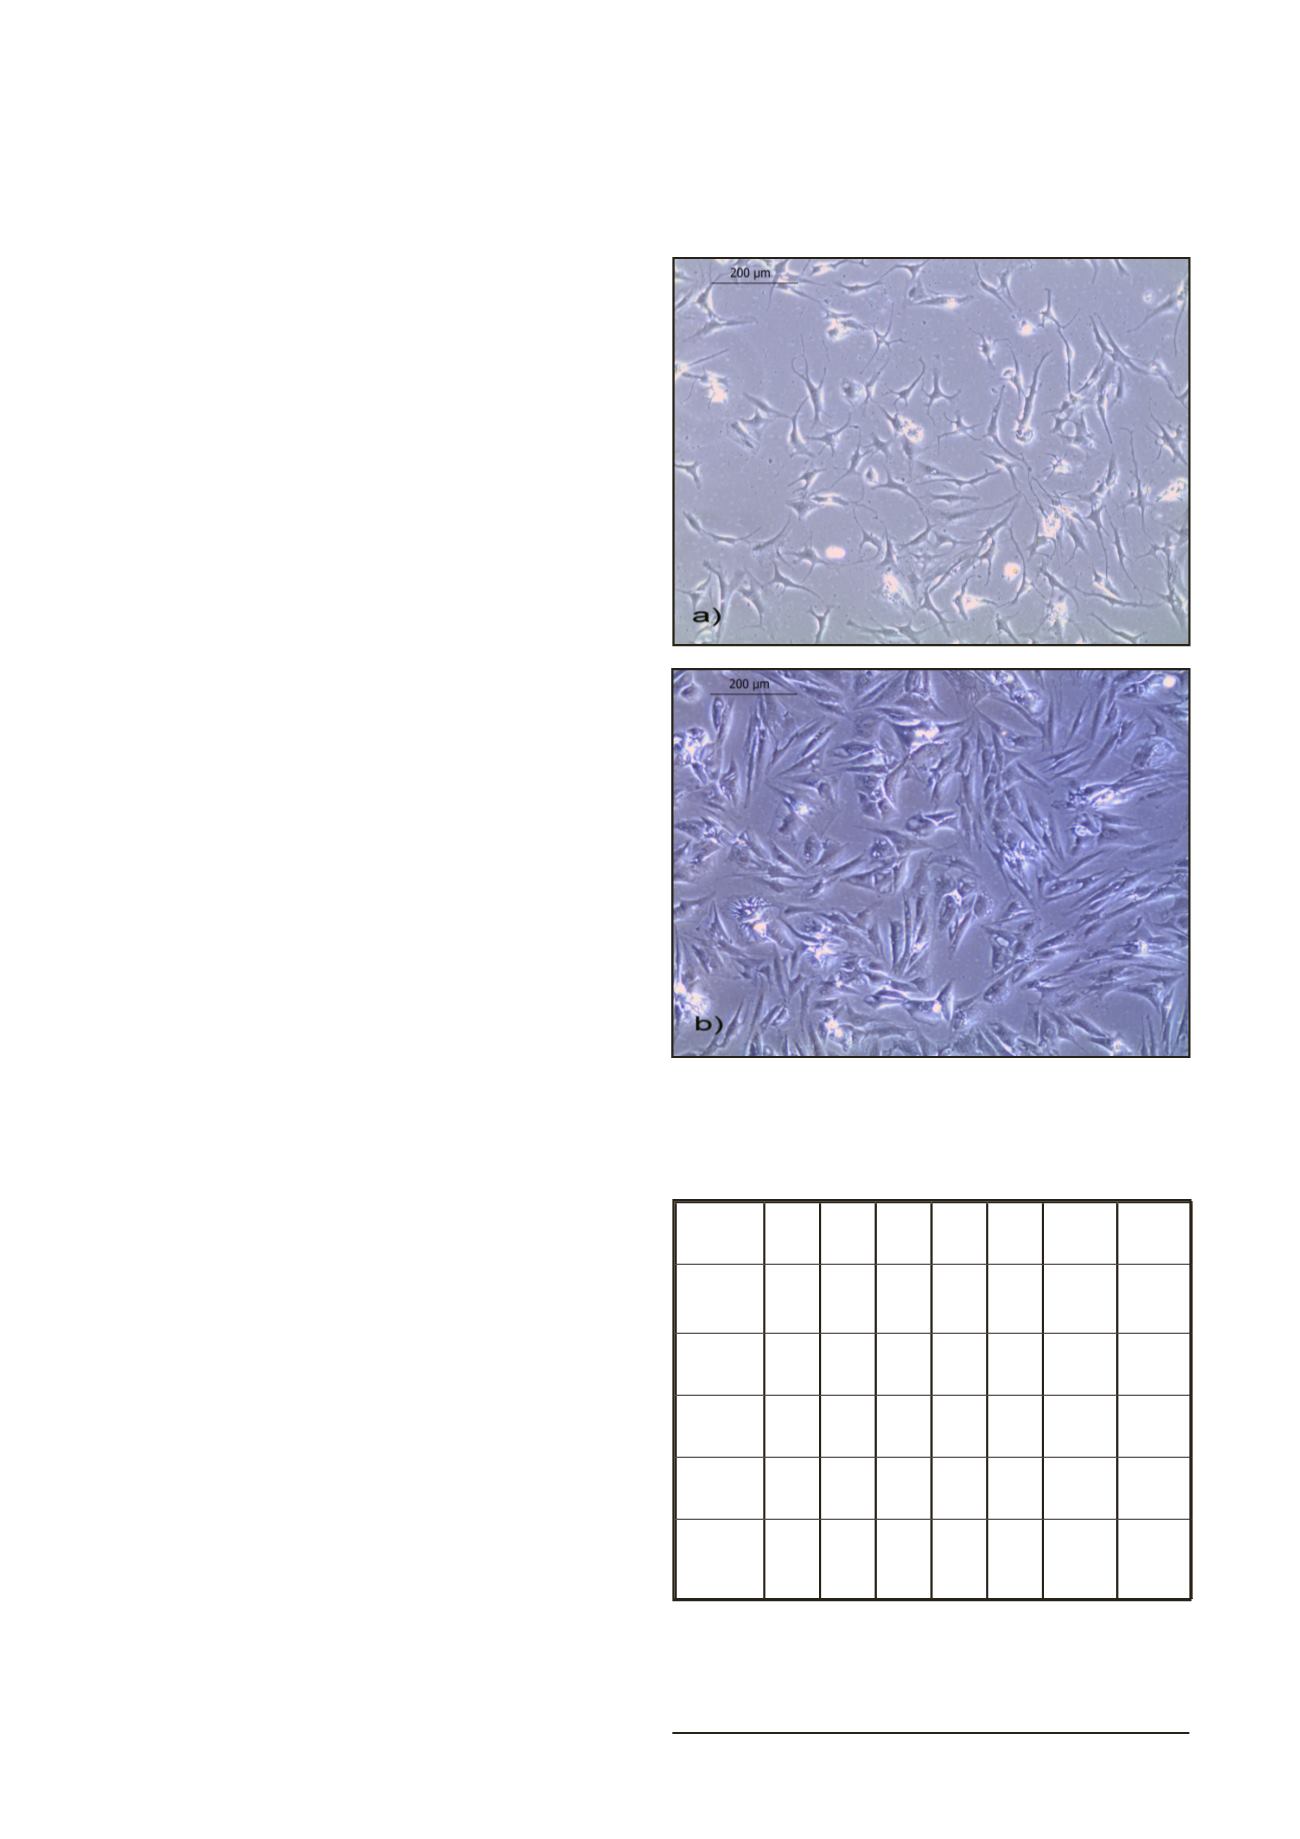
of cultivation chondrocytes had more polygonal structure, even
though few of cells had spindle/fibroblast like morphology (Fig.
2b). Chondrocytes reached confluence within 3 to 4 weeks.
Average number of chondrocytes obtained after trypsinization
(P1) was 2,23 x 10⁶ ± 0,5 per mL (Tab. 1).
Phenotype characterization of chondrocytes
Flow cytometric analysis showed that chondrocytes were
positive for CD44 (98,35% ± 0,50), CD90 (97,15% ± 0,13) after
first passage (P1) and the cells were negative for hematopoietic
marker CD45 (0,21% ± 0,11) (Fig.3, Tab.1). Data are expressed
as means ± SD (n=5).
DISCUSSION
The objective of chondrocyte manipulation suitable for
autologous implantation is to obtain viable and phenotypically
stable cells able to enhance repair processes in the damaged
area of human cartilage. Despite the importance of the
extracellular matrix, the cells are responsible for the balanced
turnover of the extracellular matrix, which is necessary for
maintenance of the integrity of the extracellular cartilage.
In vitro
expansion of chondrocytes is possible via monolayer
culture, whereby the cells alter their morphology and
metabolism in a process known as dedifferentiation (11).
The importance of monolayer expansion of cells from small
biopsies is their clinical application in repair strategies such as
autologous chondrocyte transplantation (5).
The aim of the present study was to determine if
chondrocytes isolated from human cartilage of five elderly
patients with osteoarthritis stage 3 maintain their proliferation
and chondrogenic potential. It is known that upon digestion of
the ECM from a cartilage biopsy and subsequent adhesion to
the culturing surface, chondrocytes re-enter the cell cycle and
proliferate. Three weeks after cultivation polygonal structures
typical for chondrocytes were observed, but spindle/fibroblast
like morphology was also detected in culture. Samples
derived from aged patients, even in regions of ‘‘normal’’
appearing cartilage, are metabolically not truly normal and
Figure 2.
Representative phase-contrast photomicrographs
(magnification: x100) of cultured human a) chondrocytes, 7
days of cultivation at P0 (heterogenous population of cells)
b) chondrocytes, 21 days of cultivation at P0 (spindle and
polygonal shaped cells)
Table 1. Characterization of chondrocytes isolated from human
cartilage of patients with osteoarthritis
Sample
1
2
3
4
5 Average SD
Number
of cells
(x10
6
)
2,53 1,62 2,35 1,81 2,82 2,23 0,50
Viability
(%)
98,00 95,00 99,00 96,00 97,00 97,00 1,58
CD90 (%)
97,32 97,08 97,11 97,24 97,01 97,15 0,13
CD44 (%)
98,00 98,13 98,97 97,87 98,80 98,35 0,50
CD45 (%)
0,12 0,10 0,32 0,30 0,23 0,21 0,10